426,845 people live in Minneapolis, where the median age is 33 and the average individual income is $50,605. Data provided by the U.S. Census Bureau.
Total Population
Median Age
Population Density Population Density This is the number of people per square mile in a neighborhood.
Average individual Income
Minneapolis Real Estate & Neighborhood Directory
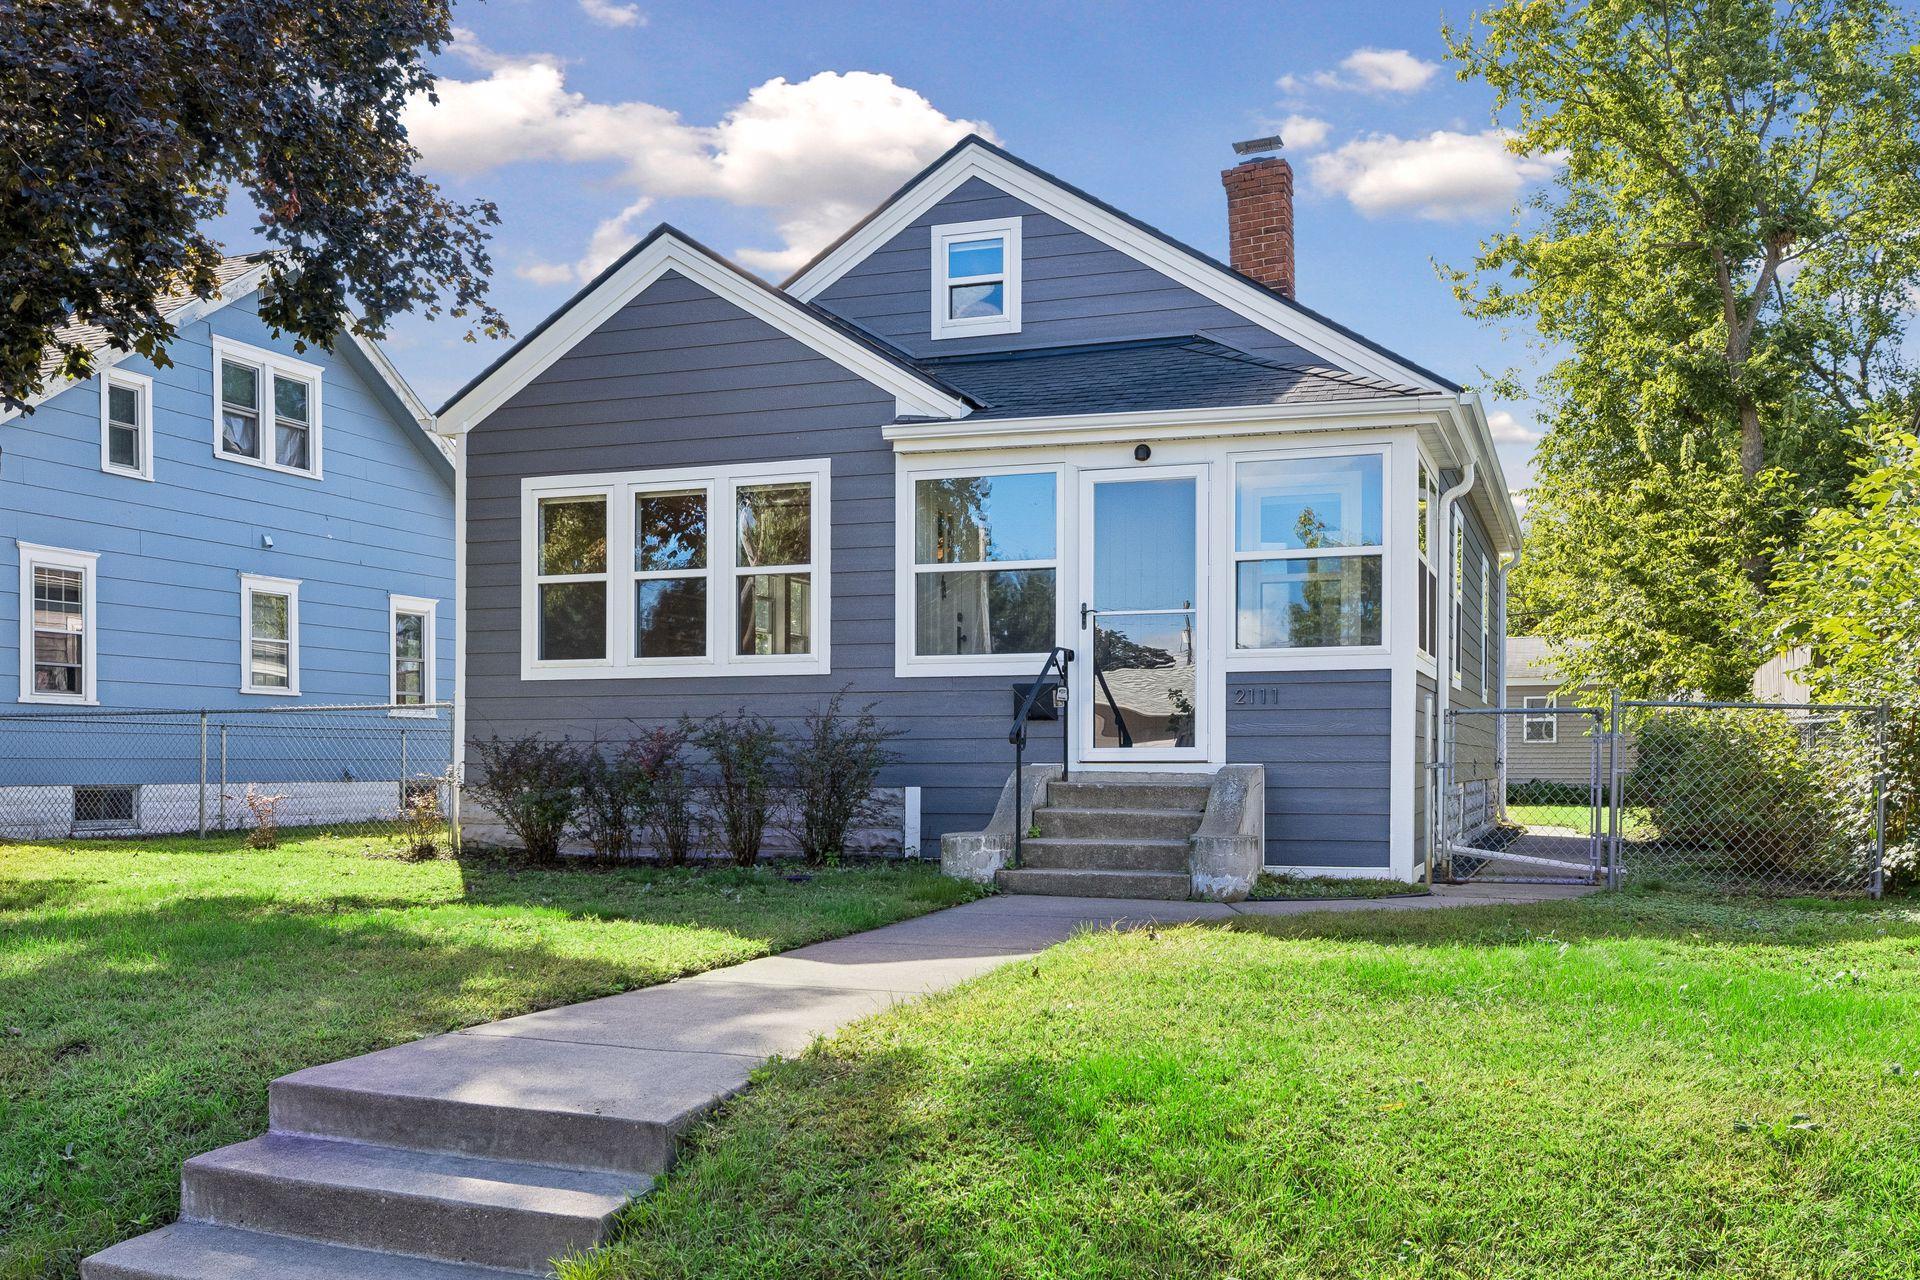
Minneapolis real estate carries a citywide median sales price of $375,000 alongside 2.0 to 3.1 months of active inventory. Top submarkets include North Loop urban lofts, Linden Hills lakeside craftsman homes, and Lake Nokomis 1920s Tudors, organized by price, lifestyle, and public school catchments.
Searching For Minneapolis Homes By Neighborhood?
Align your localized research with active Twin Cities inventory. Choose your preferred metropolitan environment below to view real-time property listings:
Upper Midwest Corporate & Lifestyle Hub
Minneapolis combines Fortune 500 corporate employment, a 9.5-mile climate-controlled Skyway system, and famous urban lakes. From industrial conversion lofts to quiet tree-lined avenues, each neighborhood offers distinct architectural styles, park access, and school catchments.
Neighborhood Enclaves
01
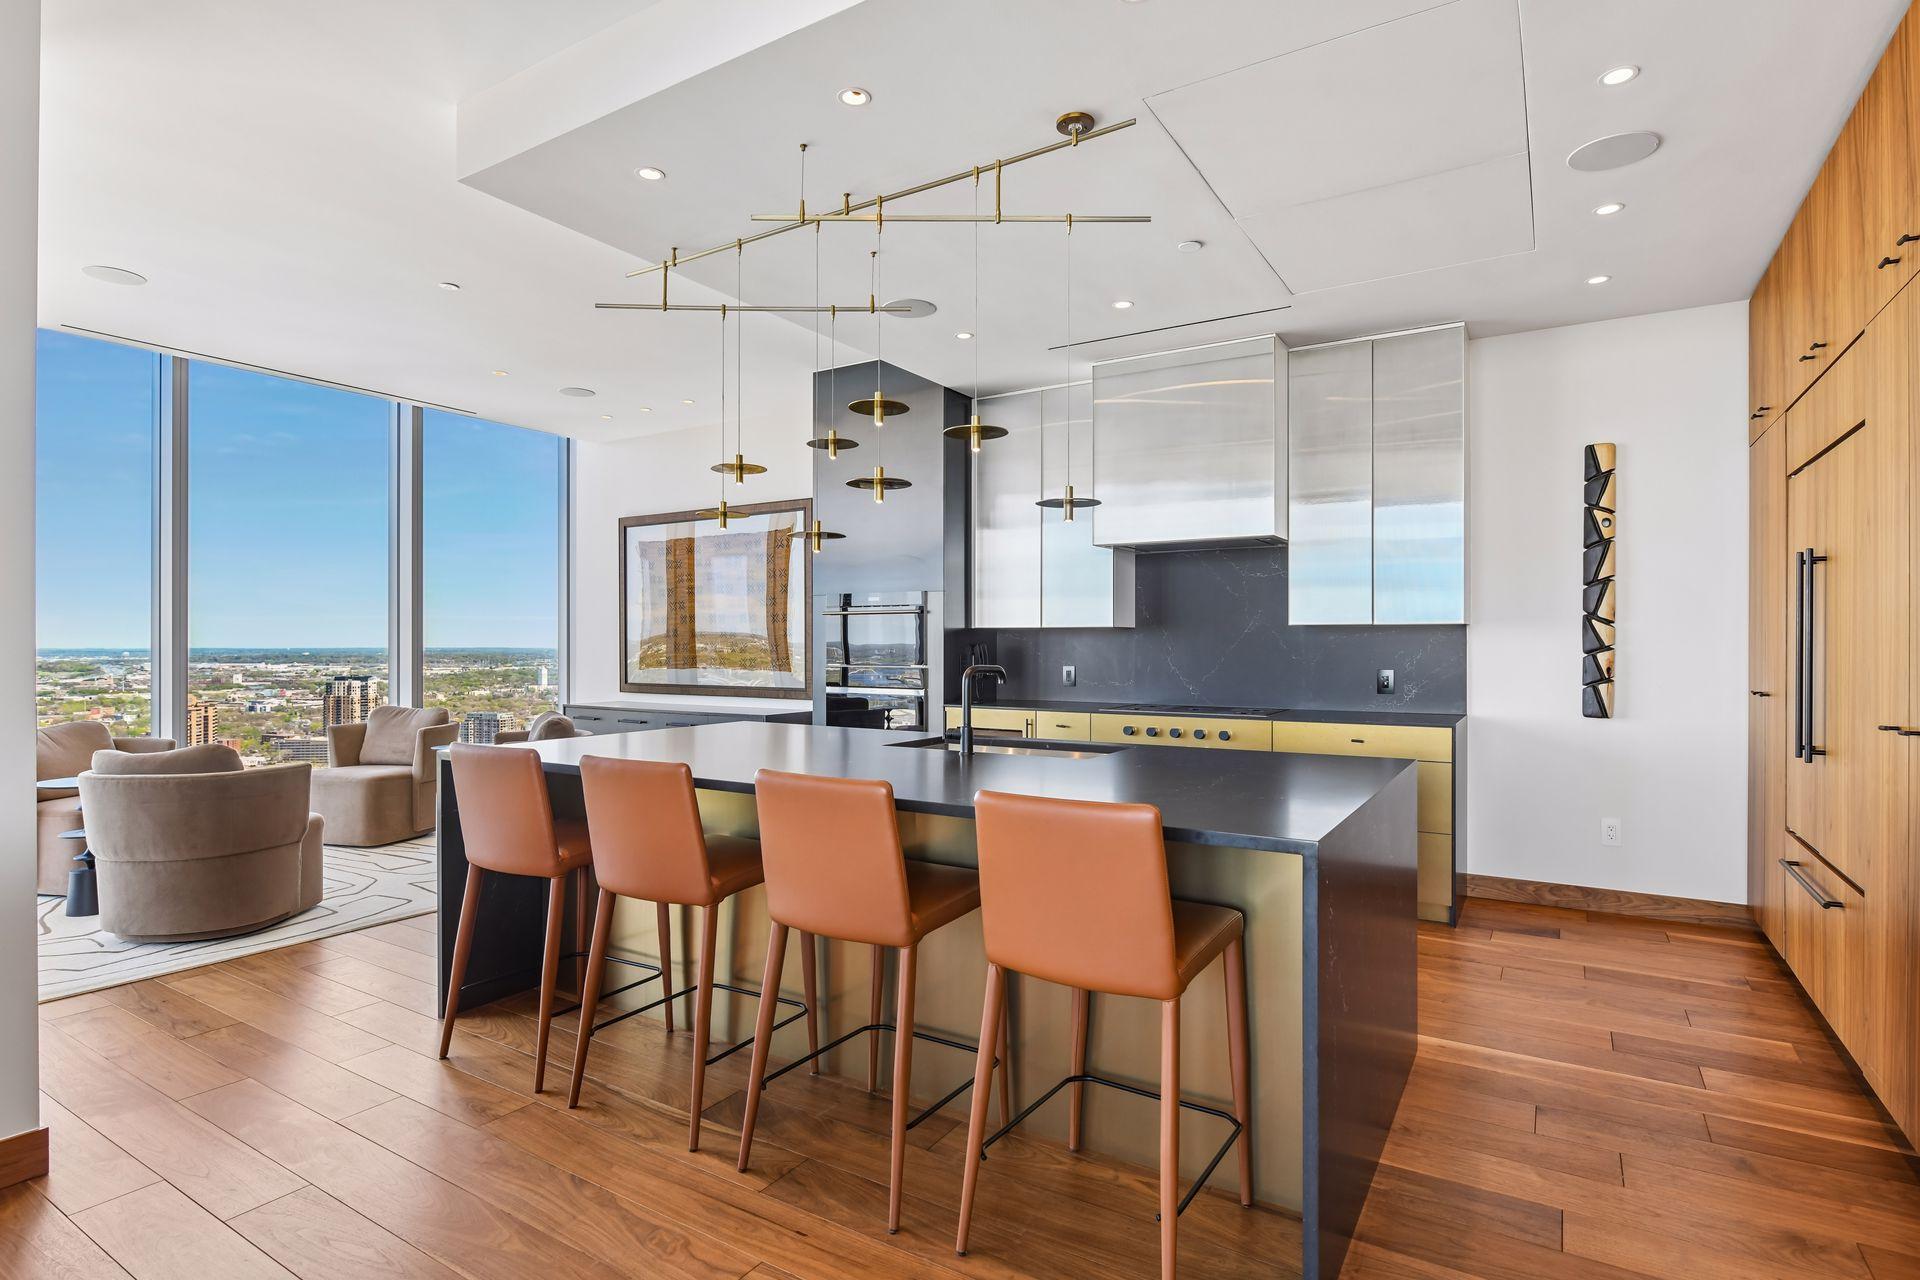
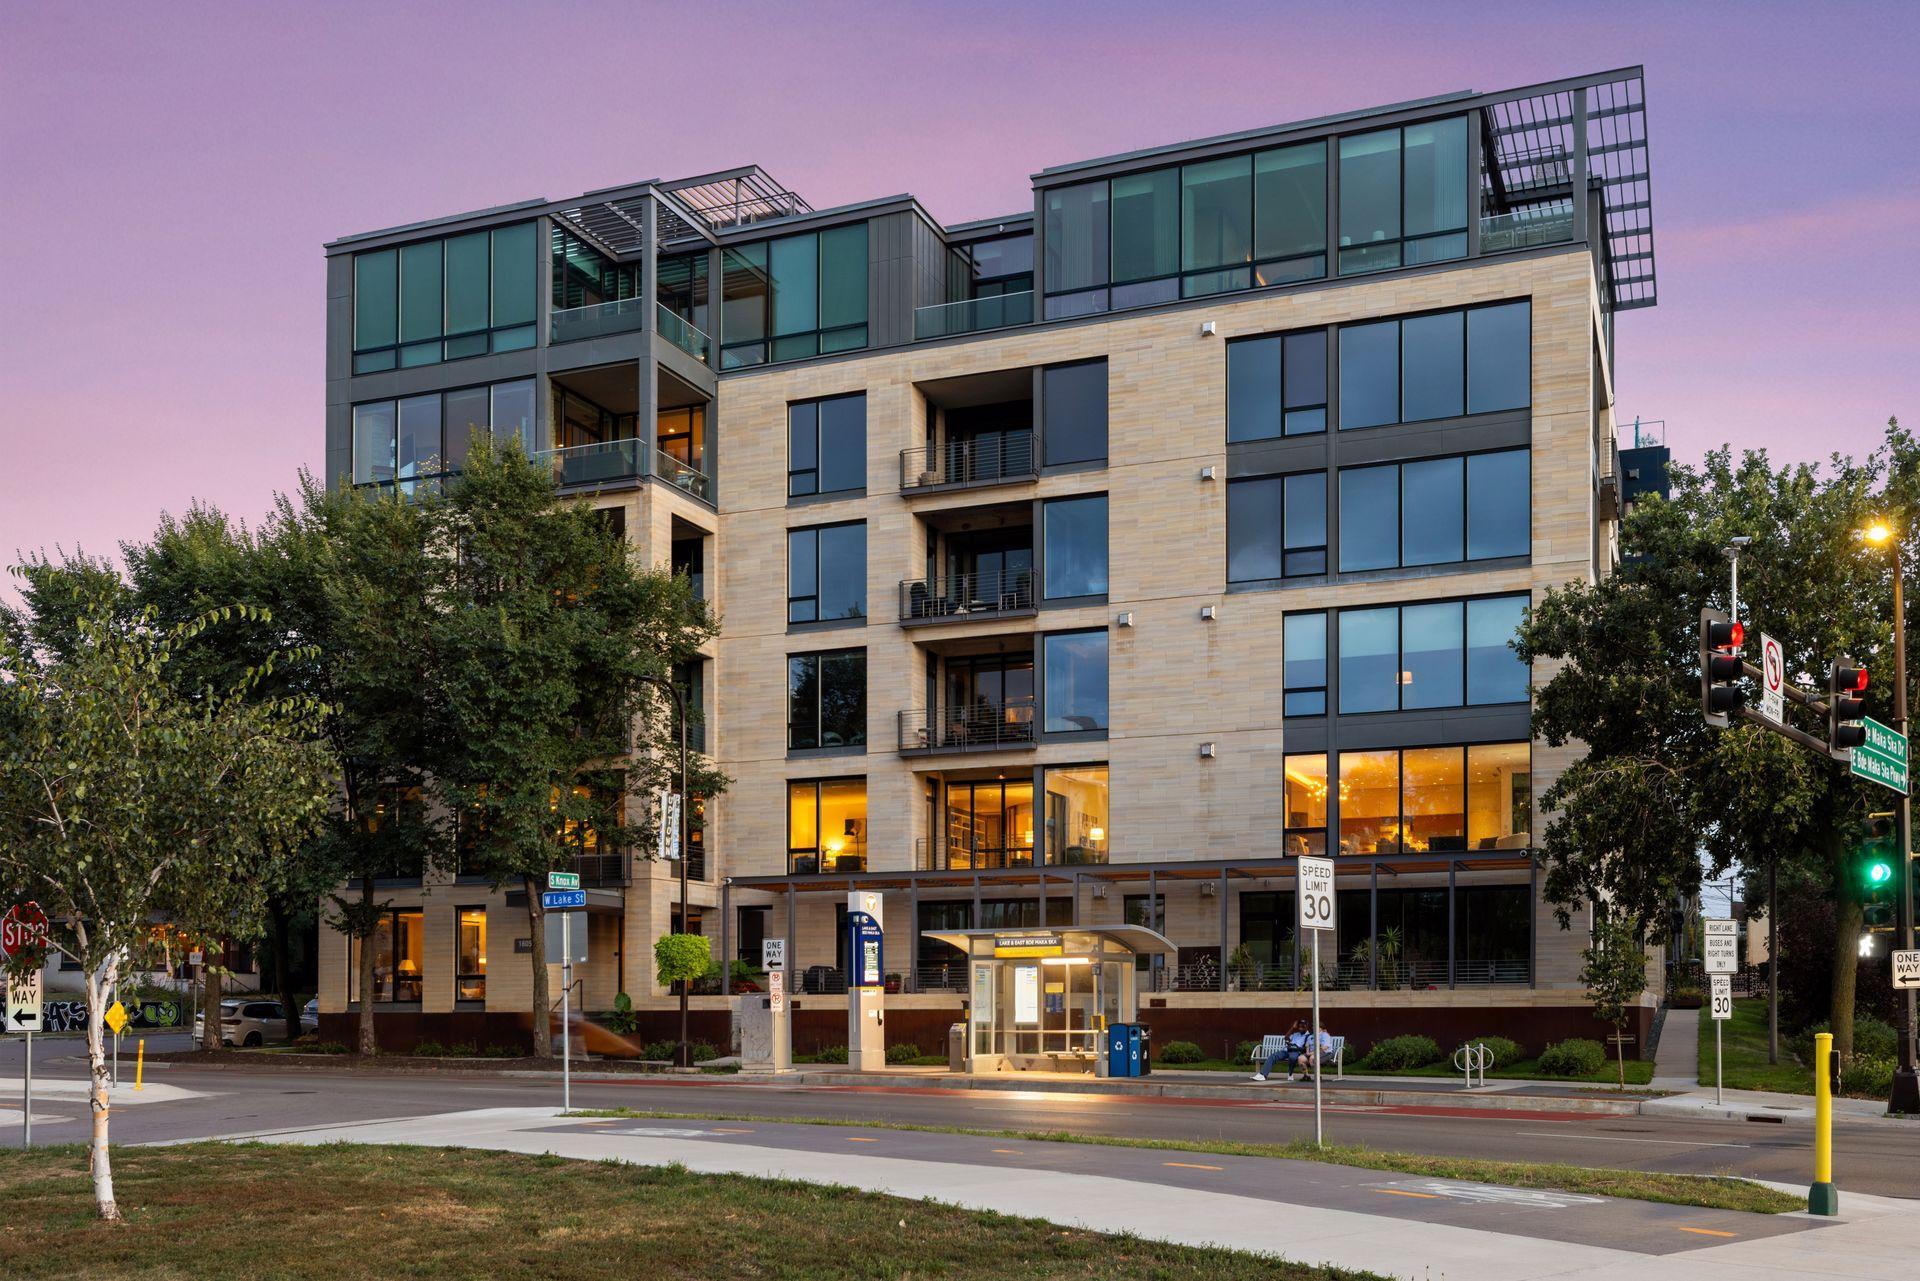
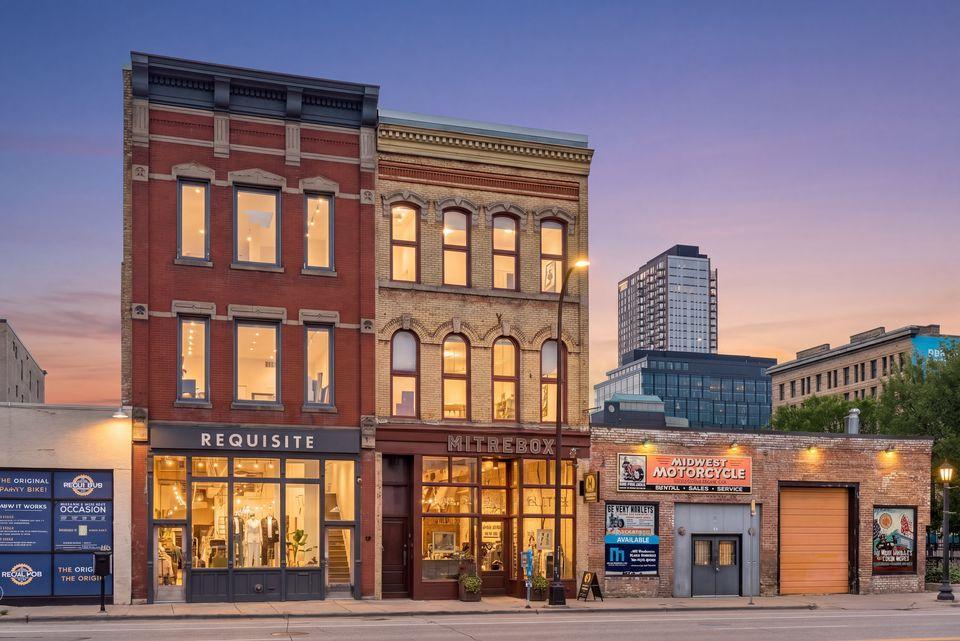
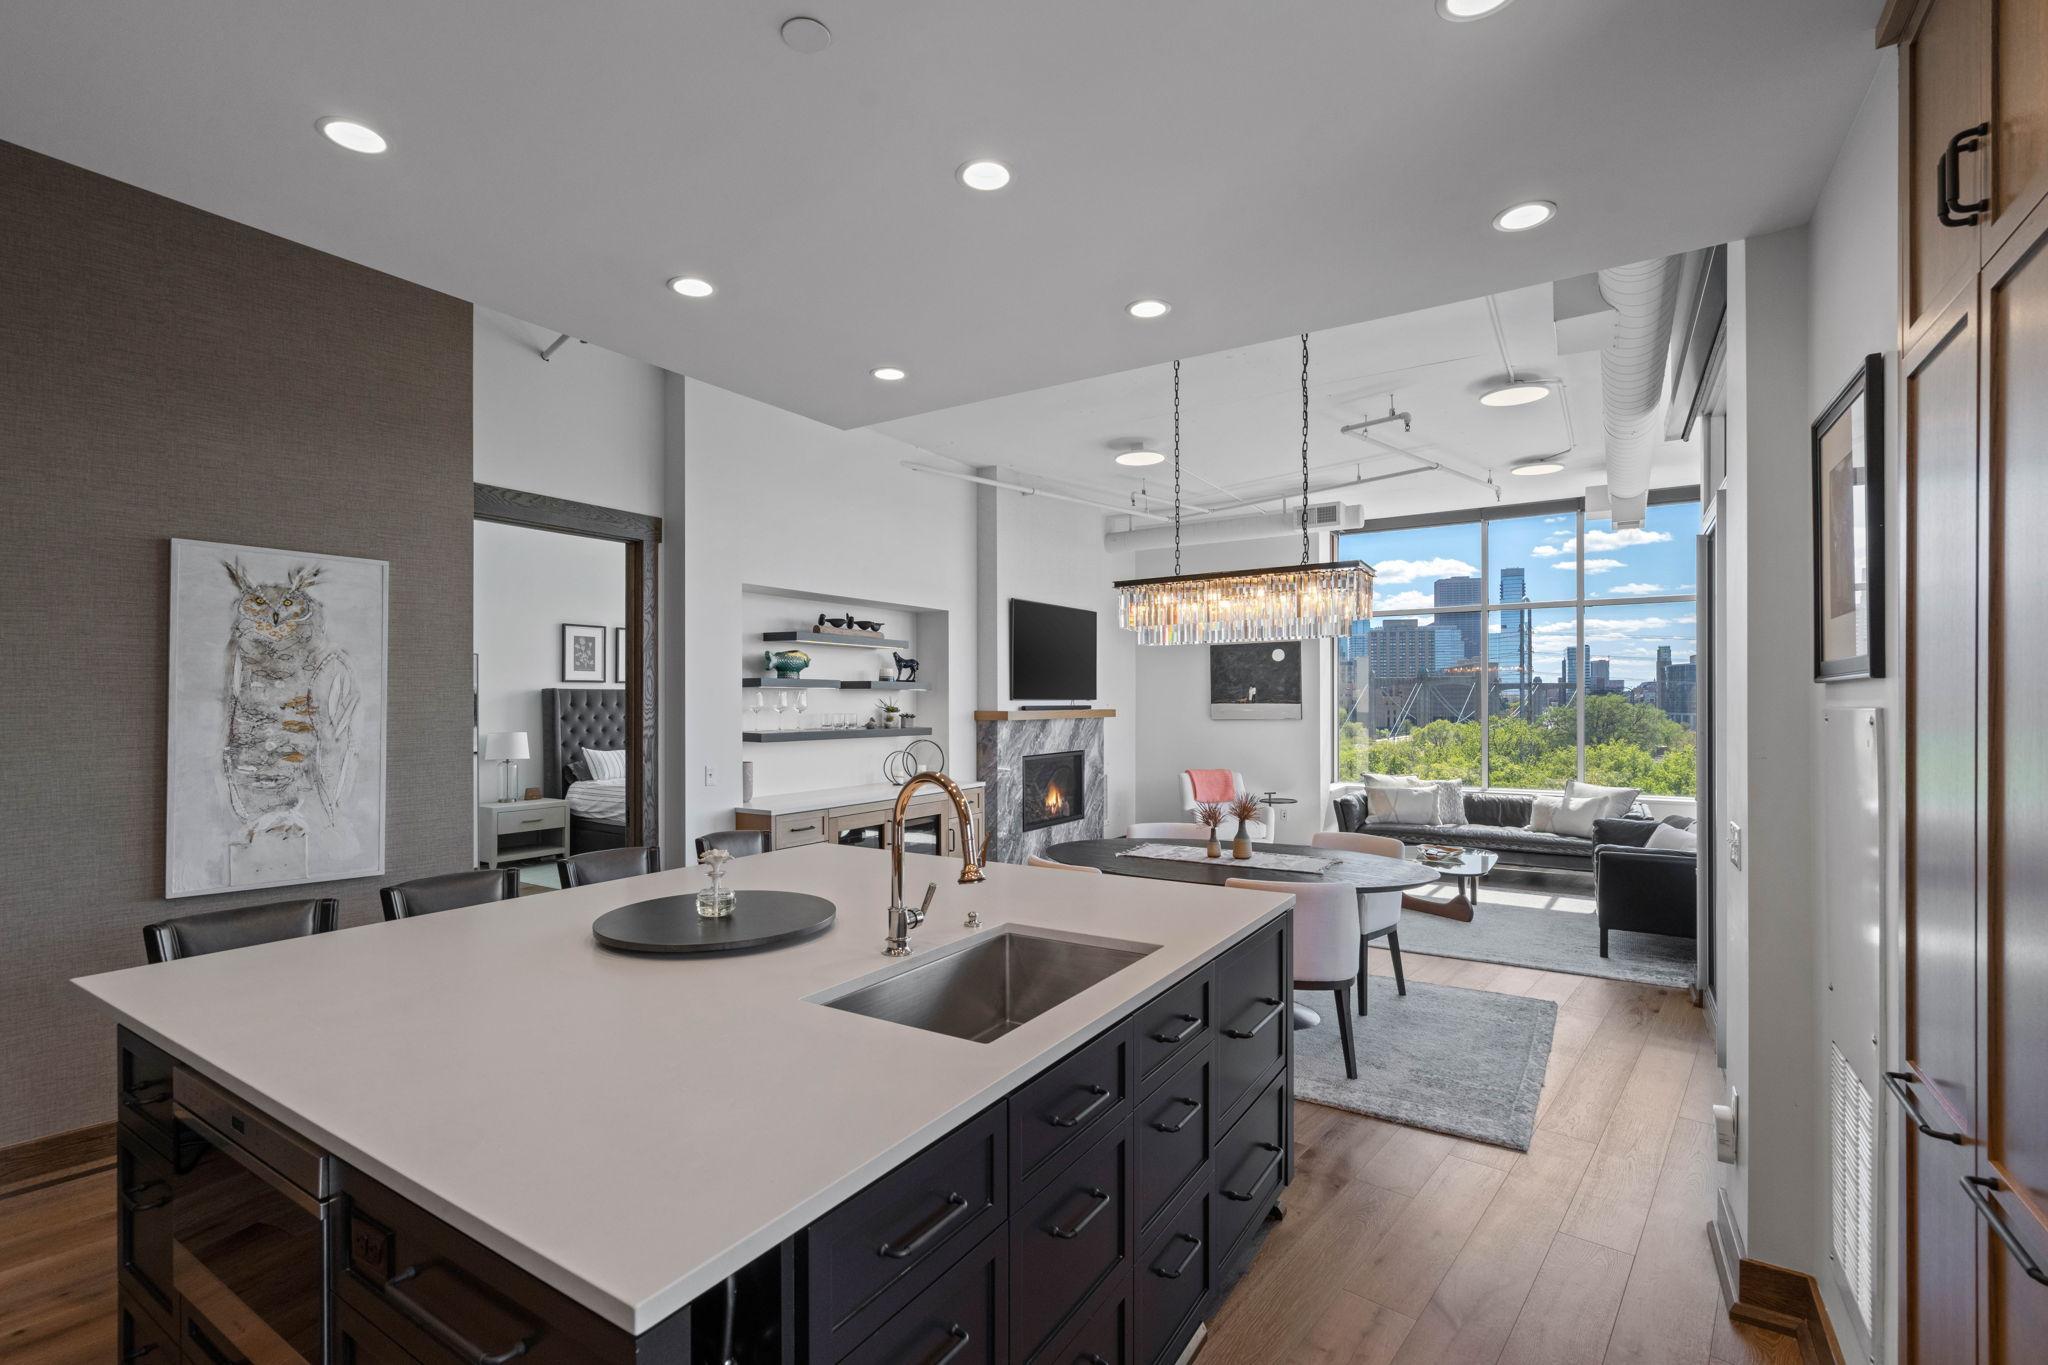
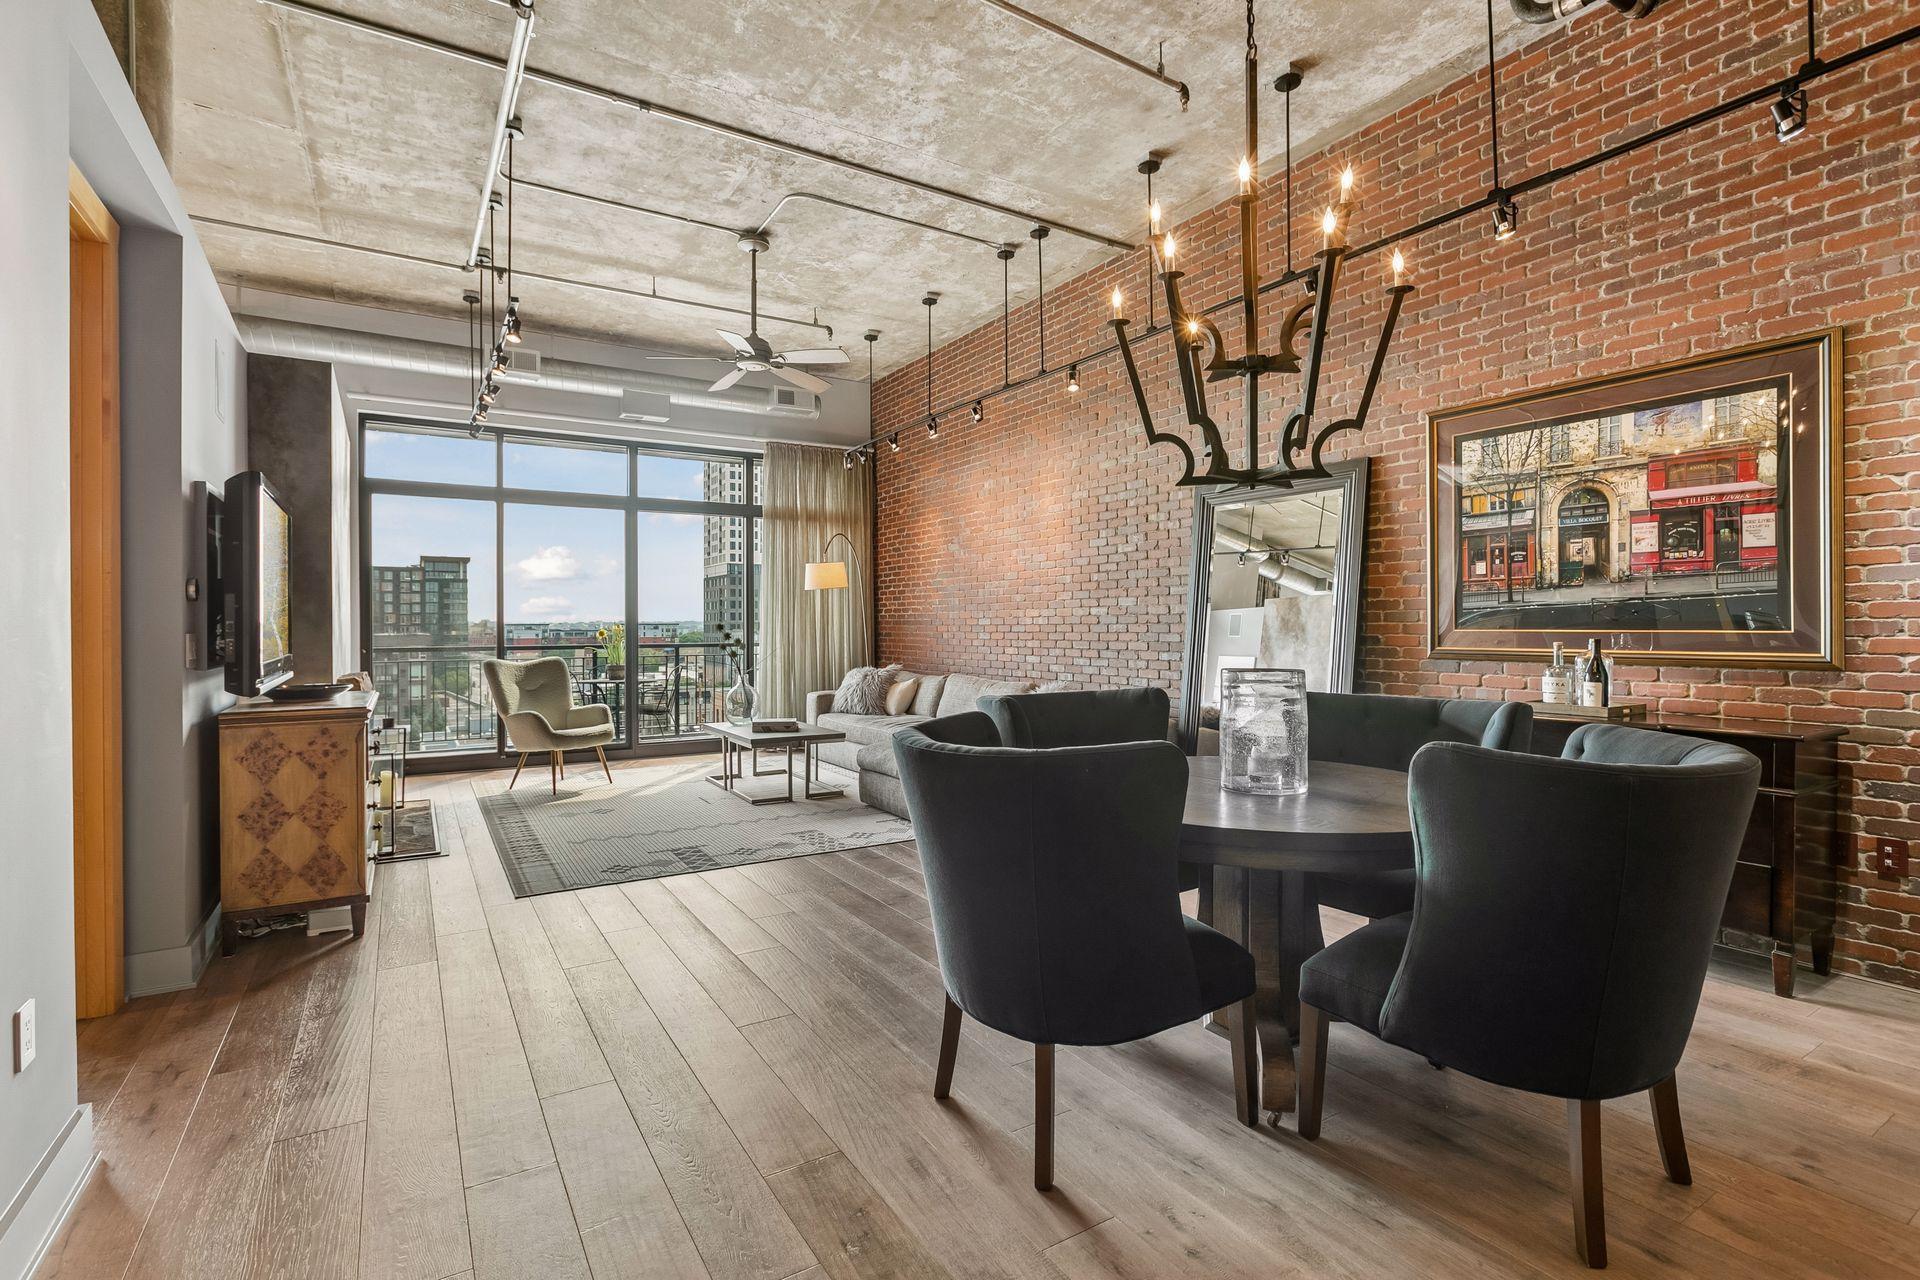
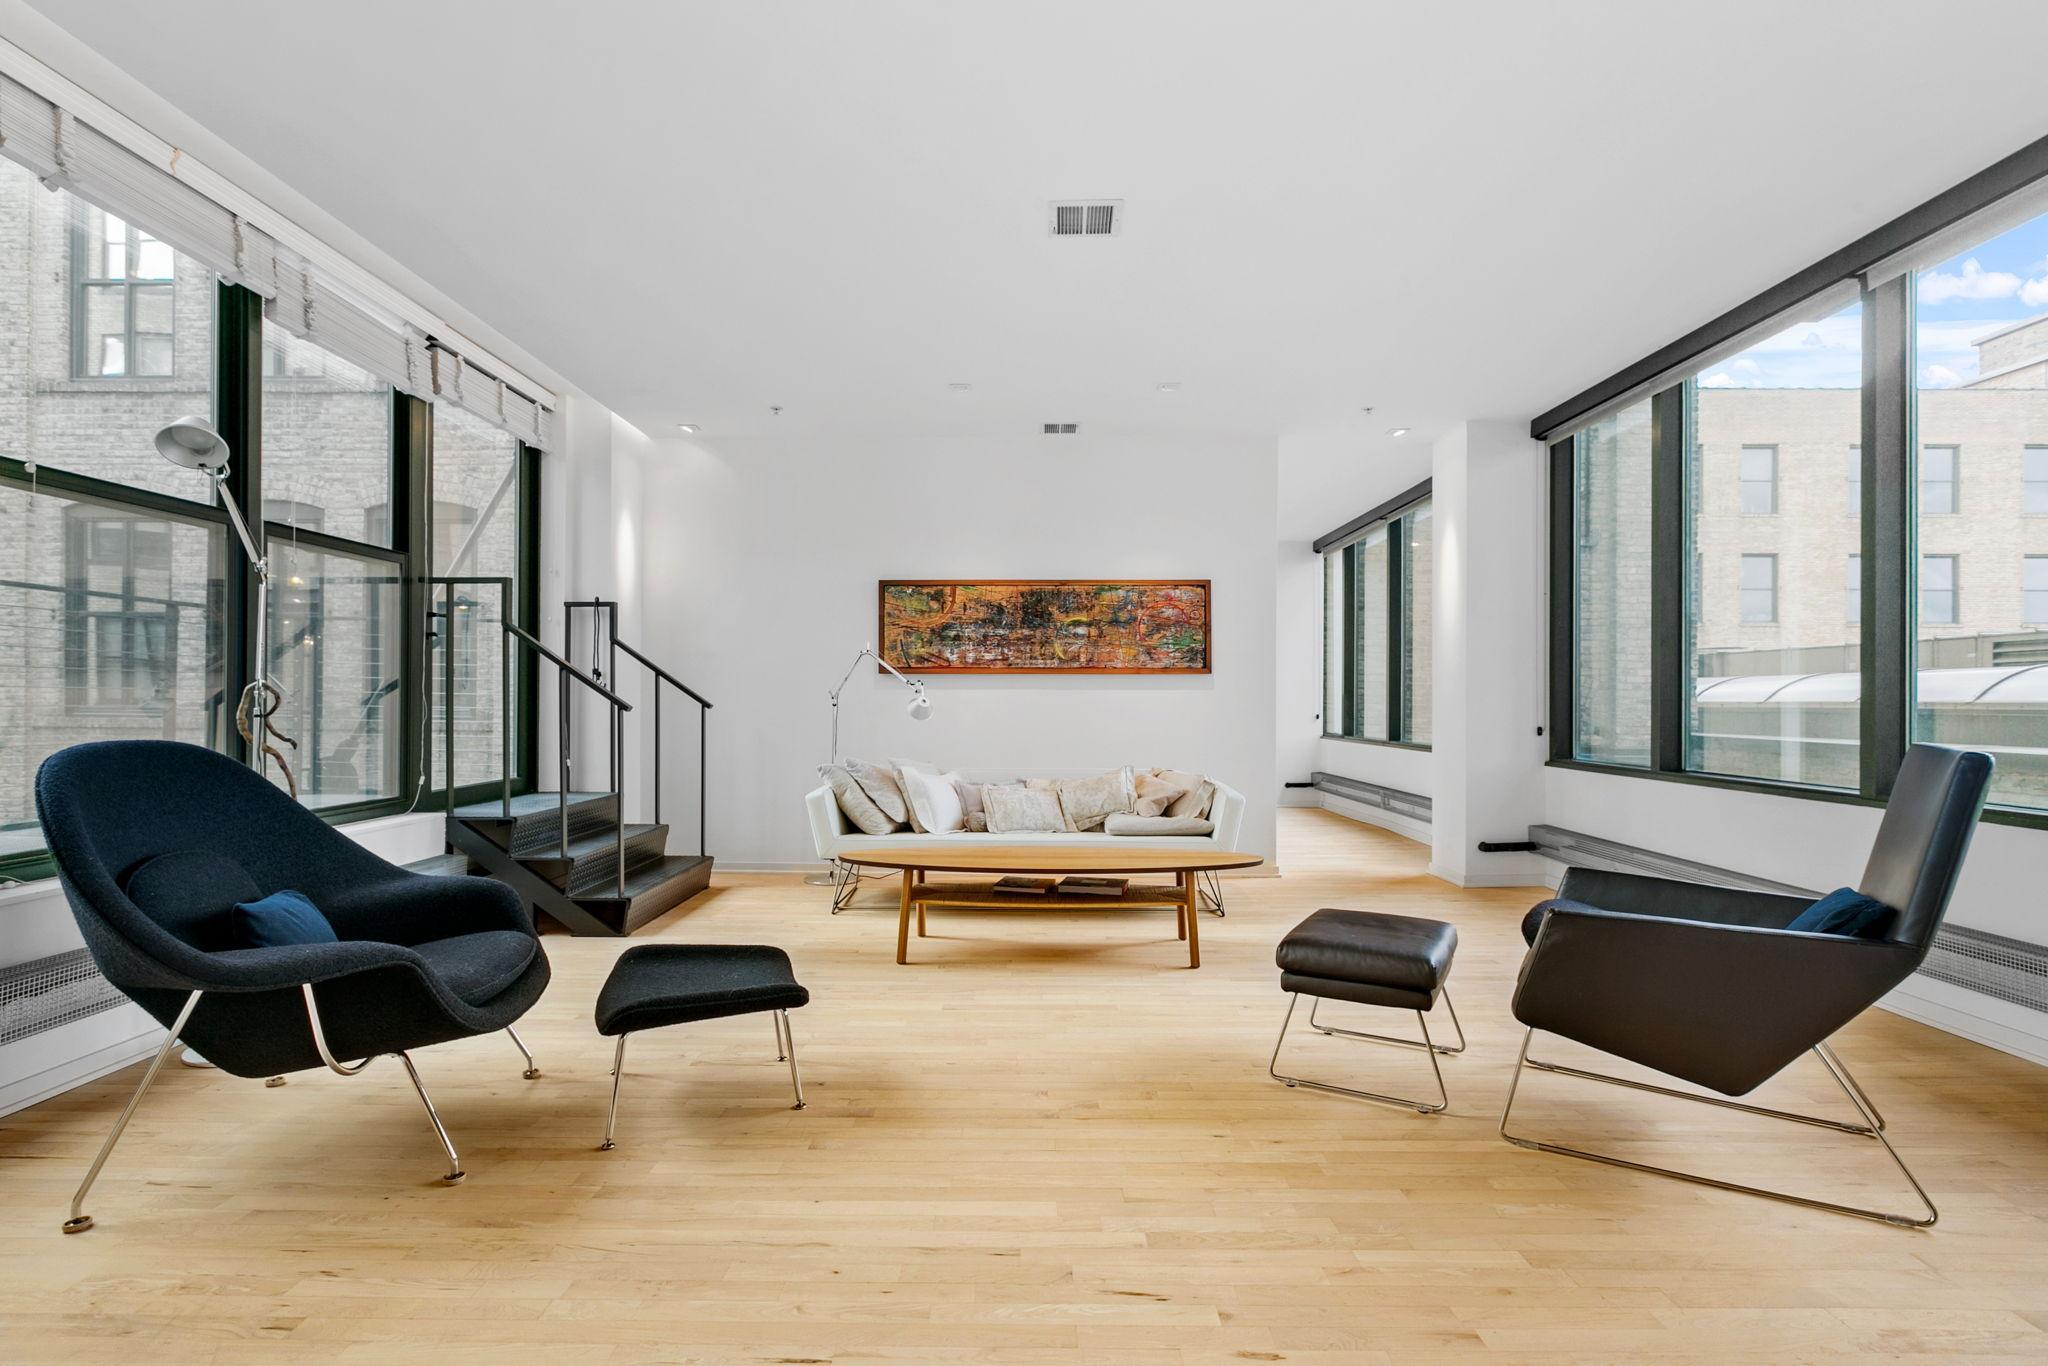
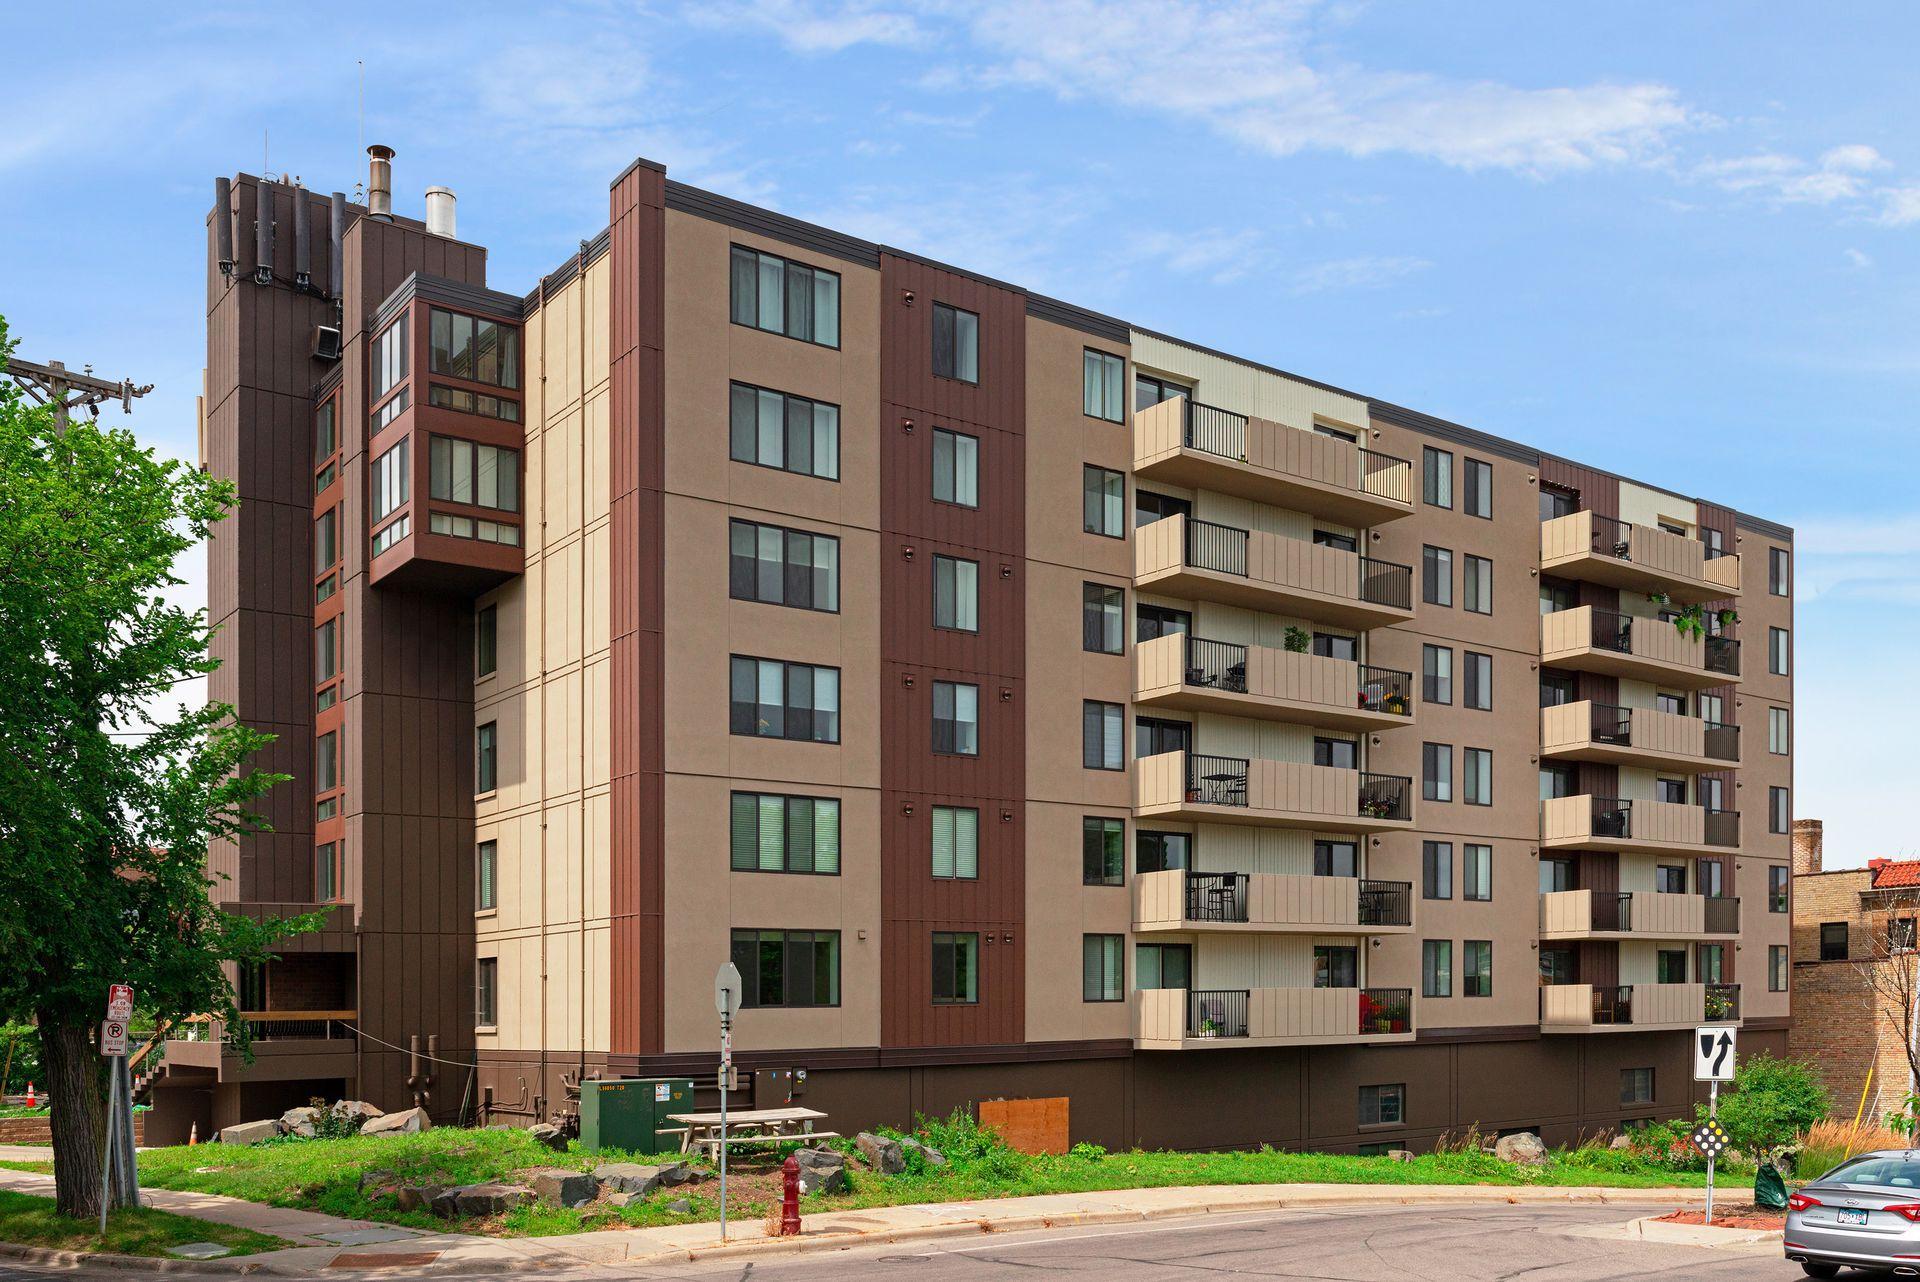
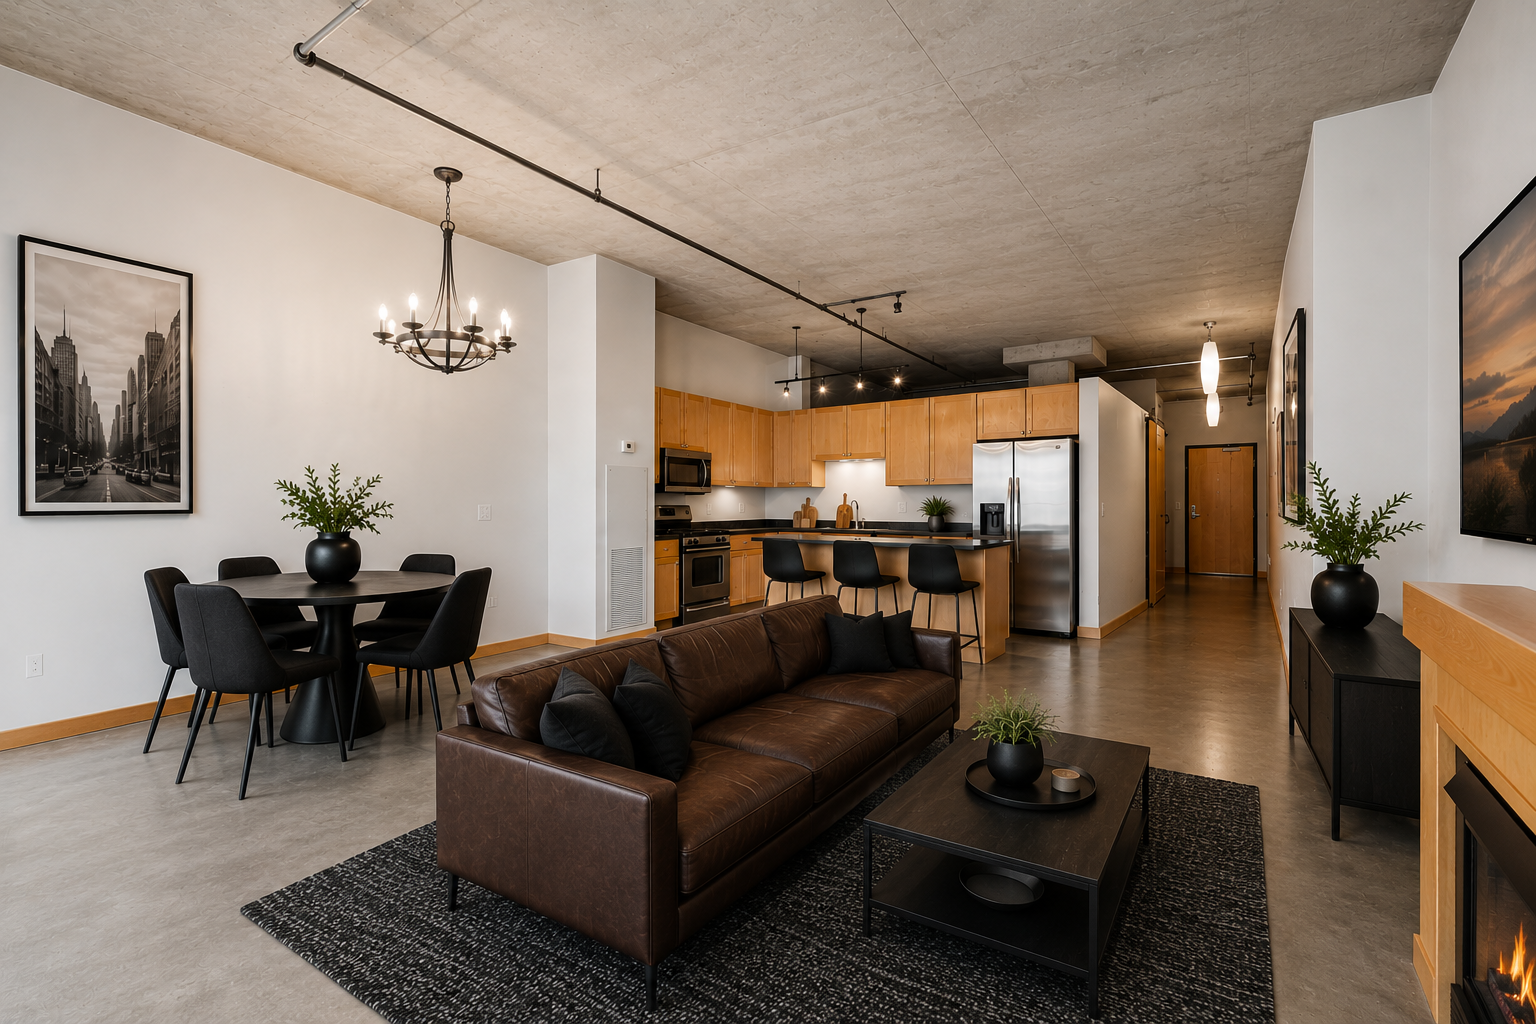
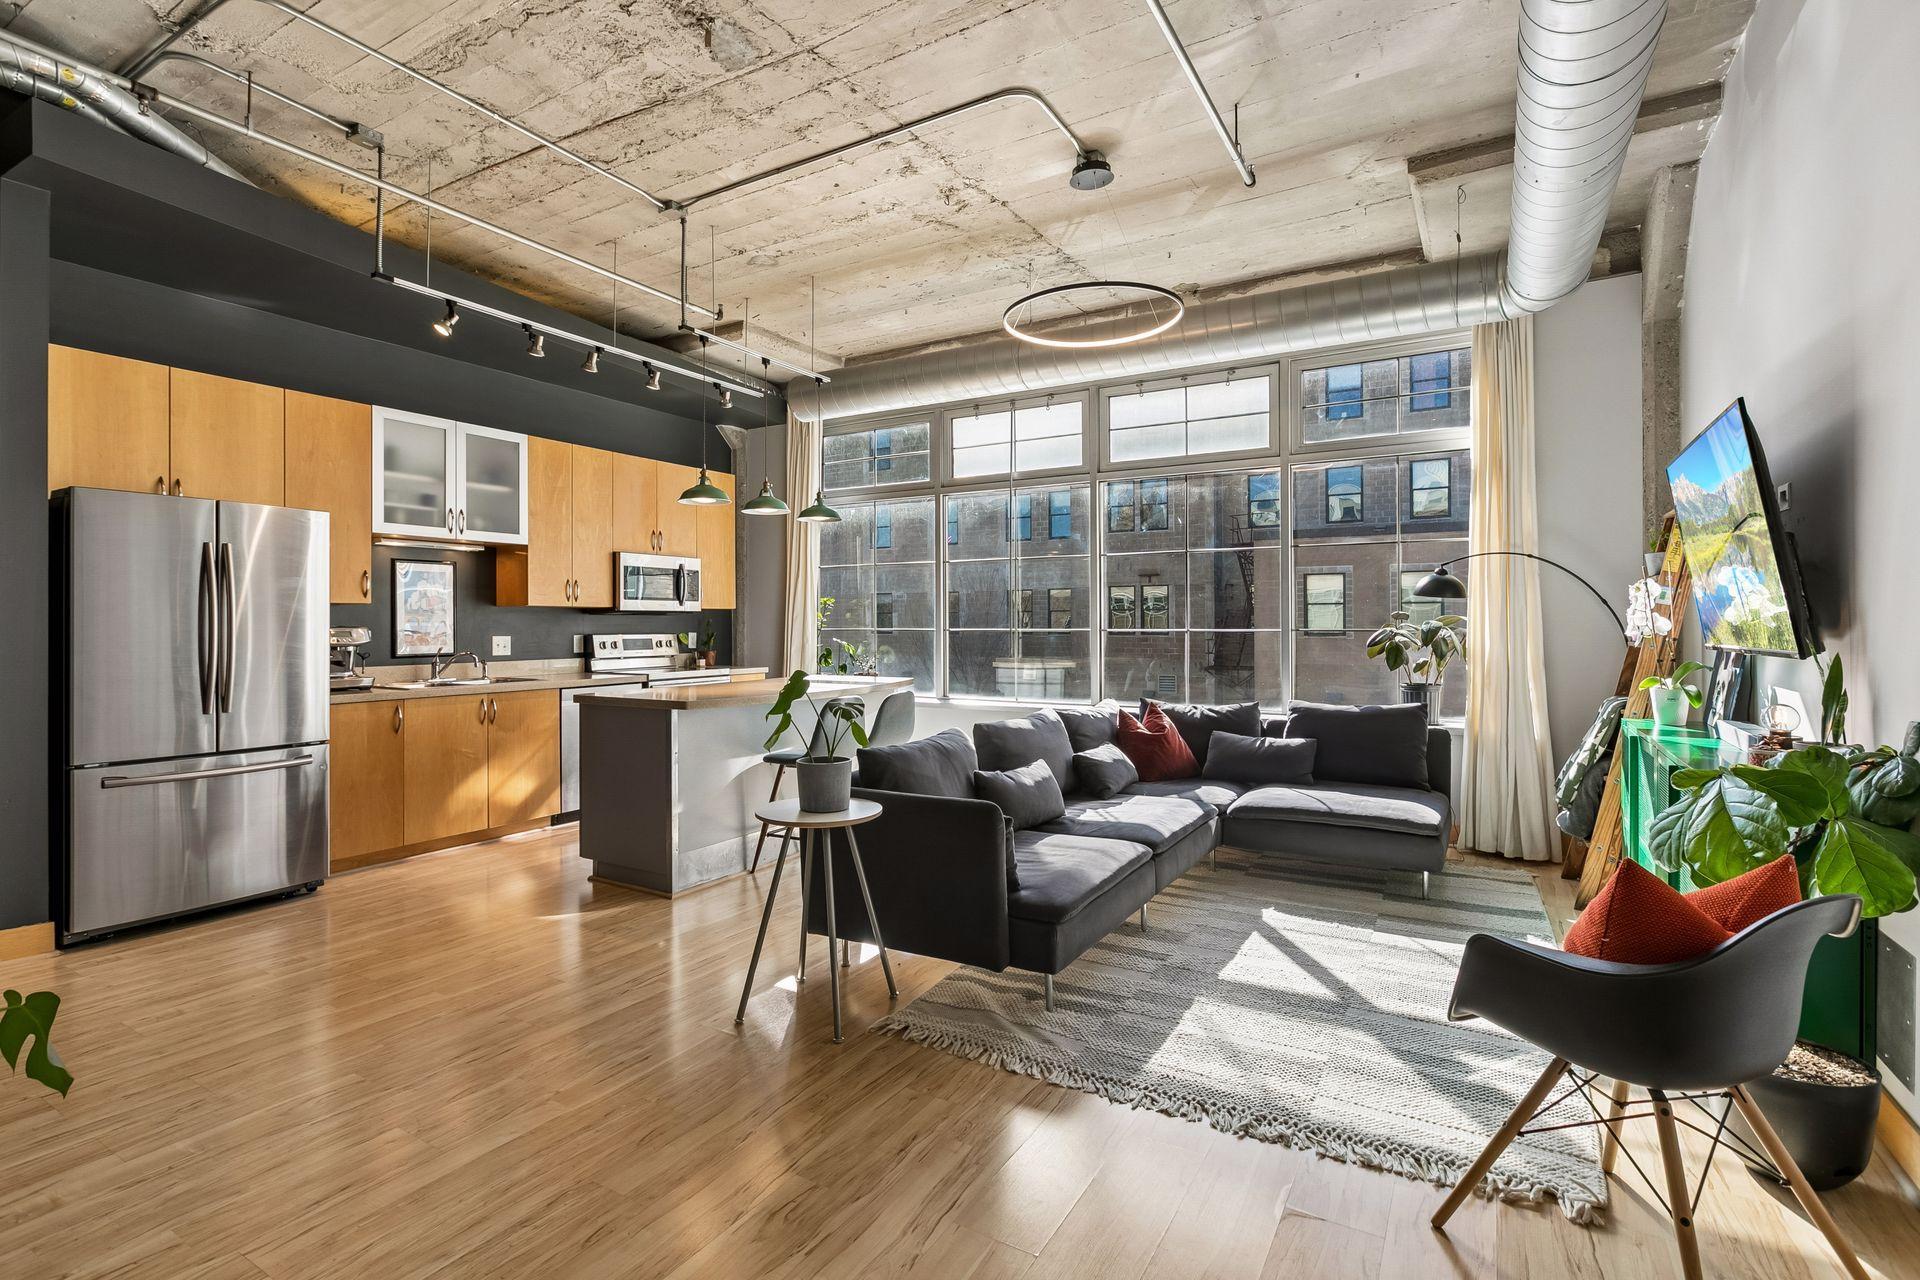
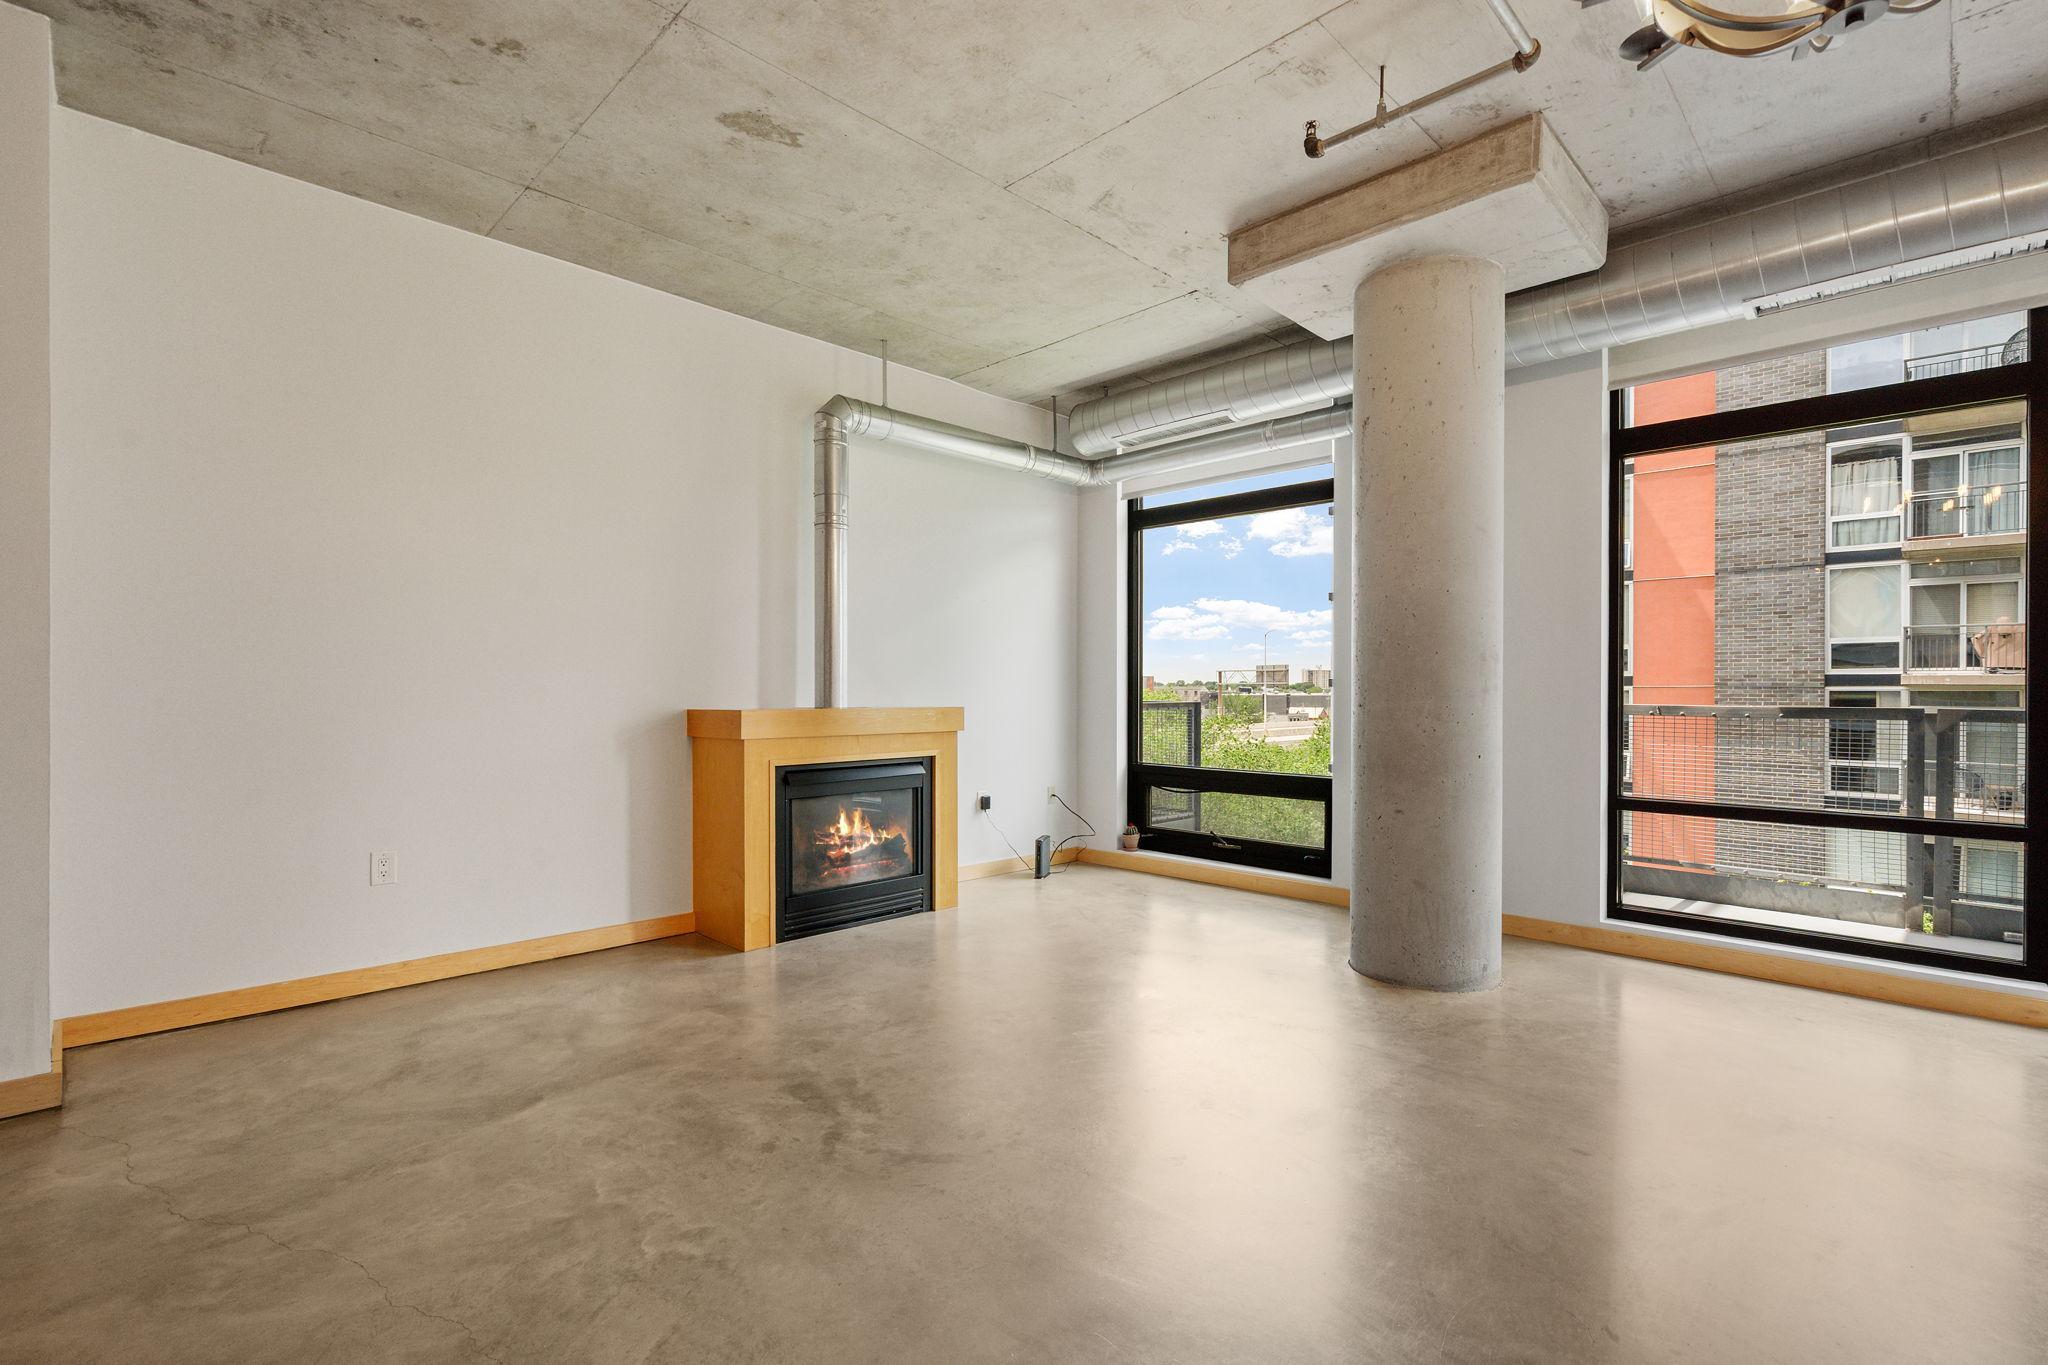
Urban Industrial LoftsHistoric brick and timber warehouse conversions located along 1st Street N and Washington Avenue N lead citywide per-square-foot appreciation metrics. Home to James Beard-nominated dining at Spoon and Stable, boutique fashion retail, and Target Field access within a brief 7-minute walk. Ideal for urban professionals, corporate executives, and multi-family investors seeking rapid capital growth and vibrant nightlife.
02
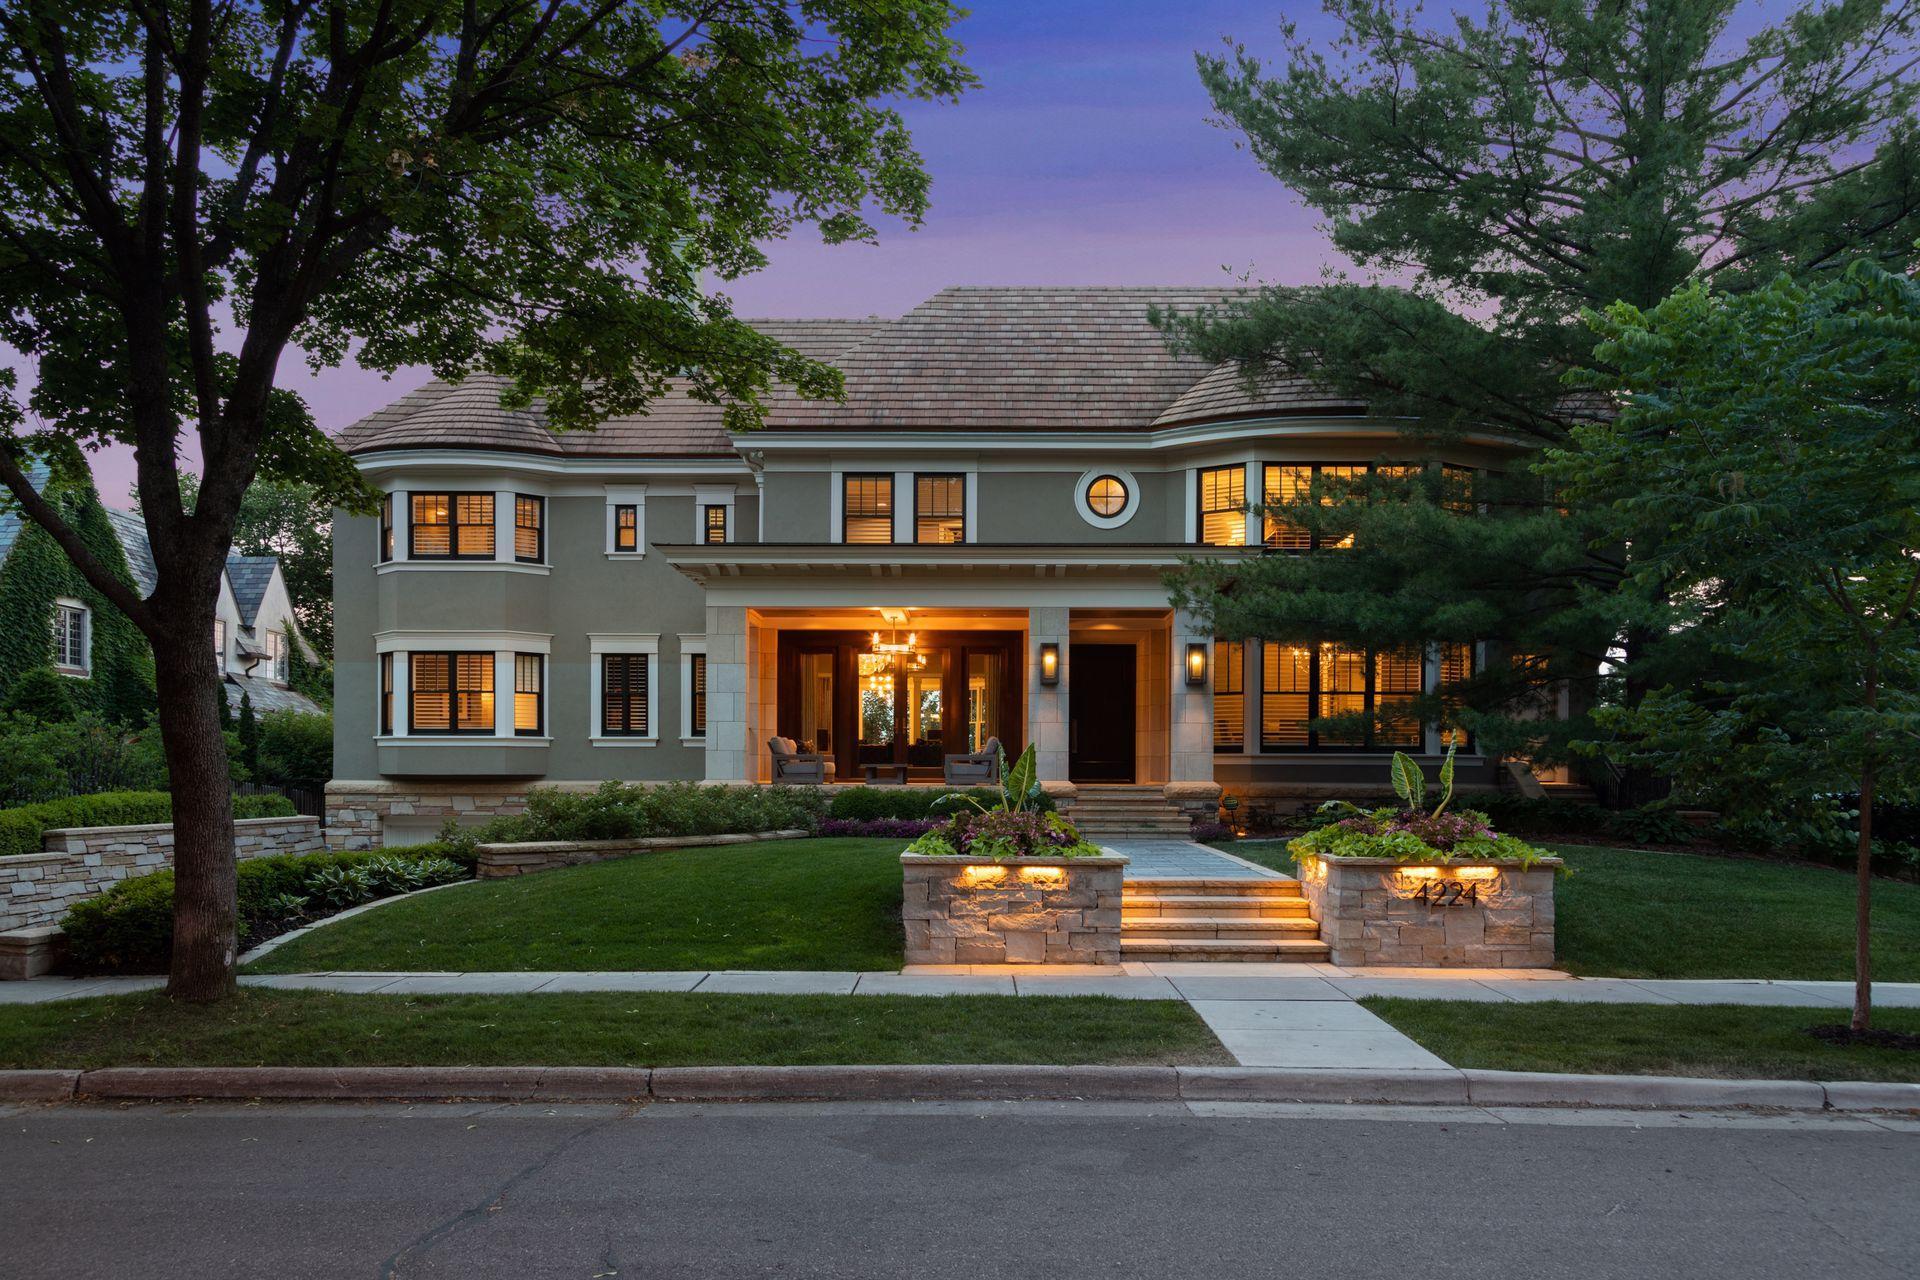
Lakeside Craftsman EnclaveClassic 1920s craftsman bungalows and expansive renovated manors fill the picturesque corridor between Lake Harriet and Bde Maka Ska. Residents enjoy short walks to Sebastian Joe's on Upton Avenue S, the Lake Harriet Bandshell, and local trolley trails. This highly sought-after district preserves tight inventory turnover while providing premier public and private educational enrollment pathways.
03
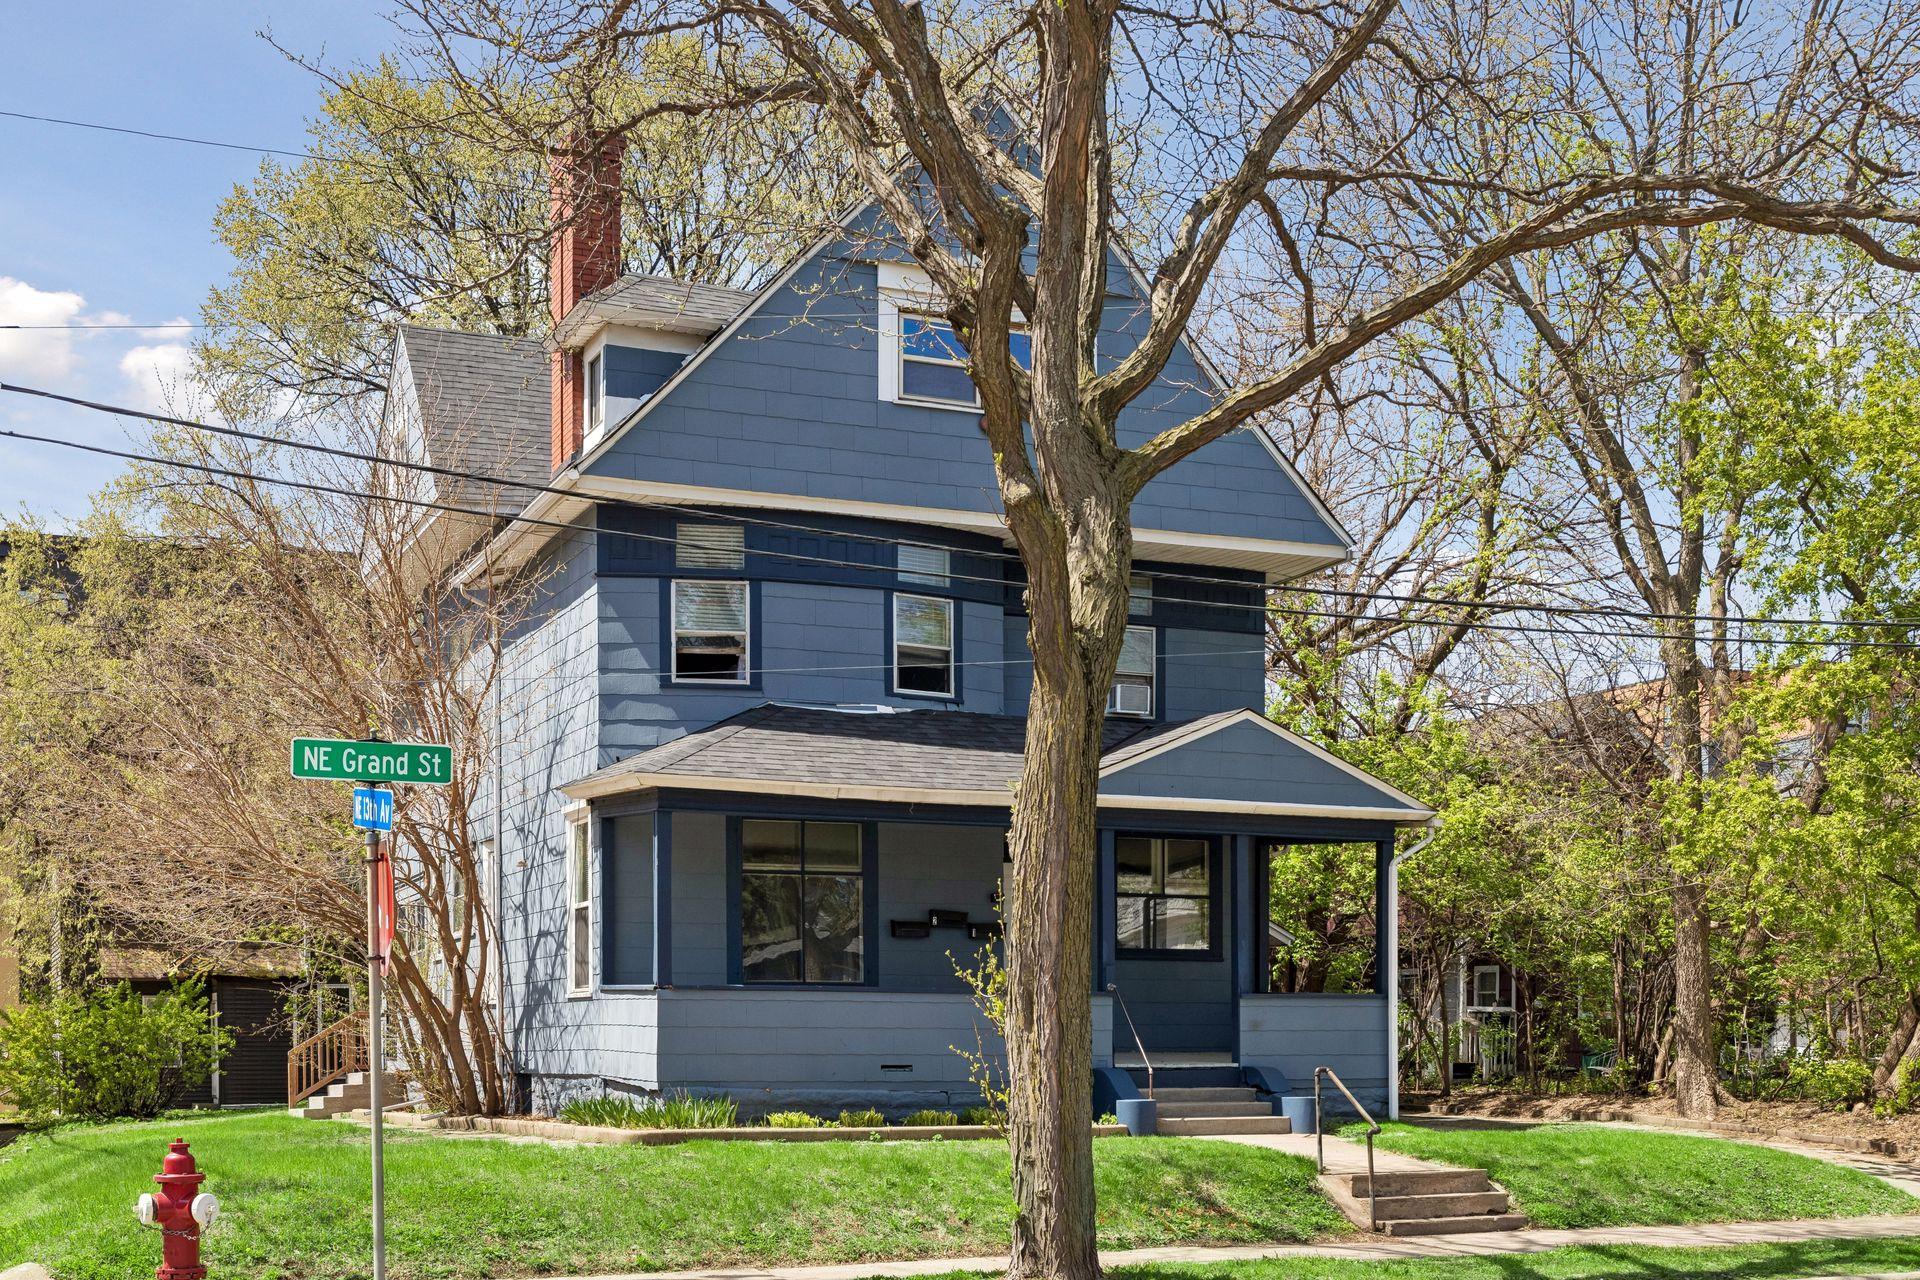
Creative Arts and Multi-FamilyCentered along Central Avenue NE, Nordeast features an expansive residential and commercial corridor packed with local artist studios, craft breweries, and riverfront parks. Iconic landmarks like Bauhaus Brew Labs, Indeed Brewing, and the Grain Belt complex draw creative professionals and investors. Multi-family duplexes and triplexes generate strong rental yields with 5.0% to 6.5% cap rates.
04
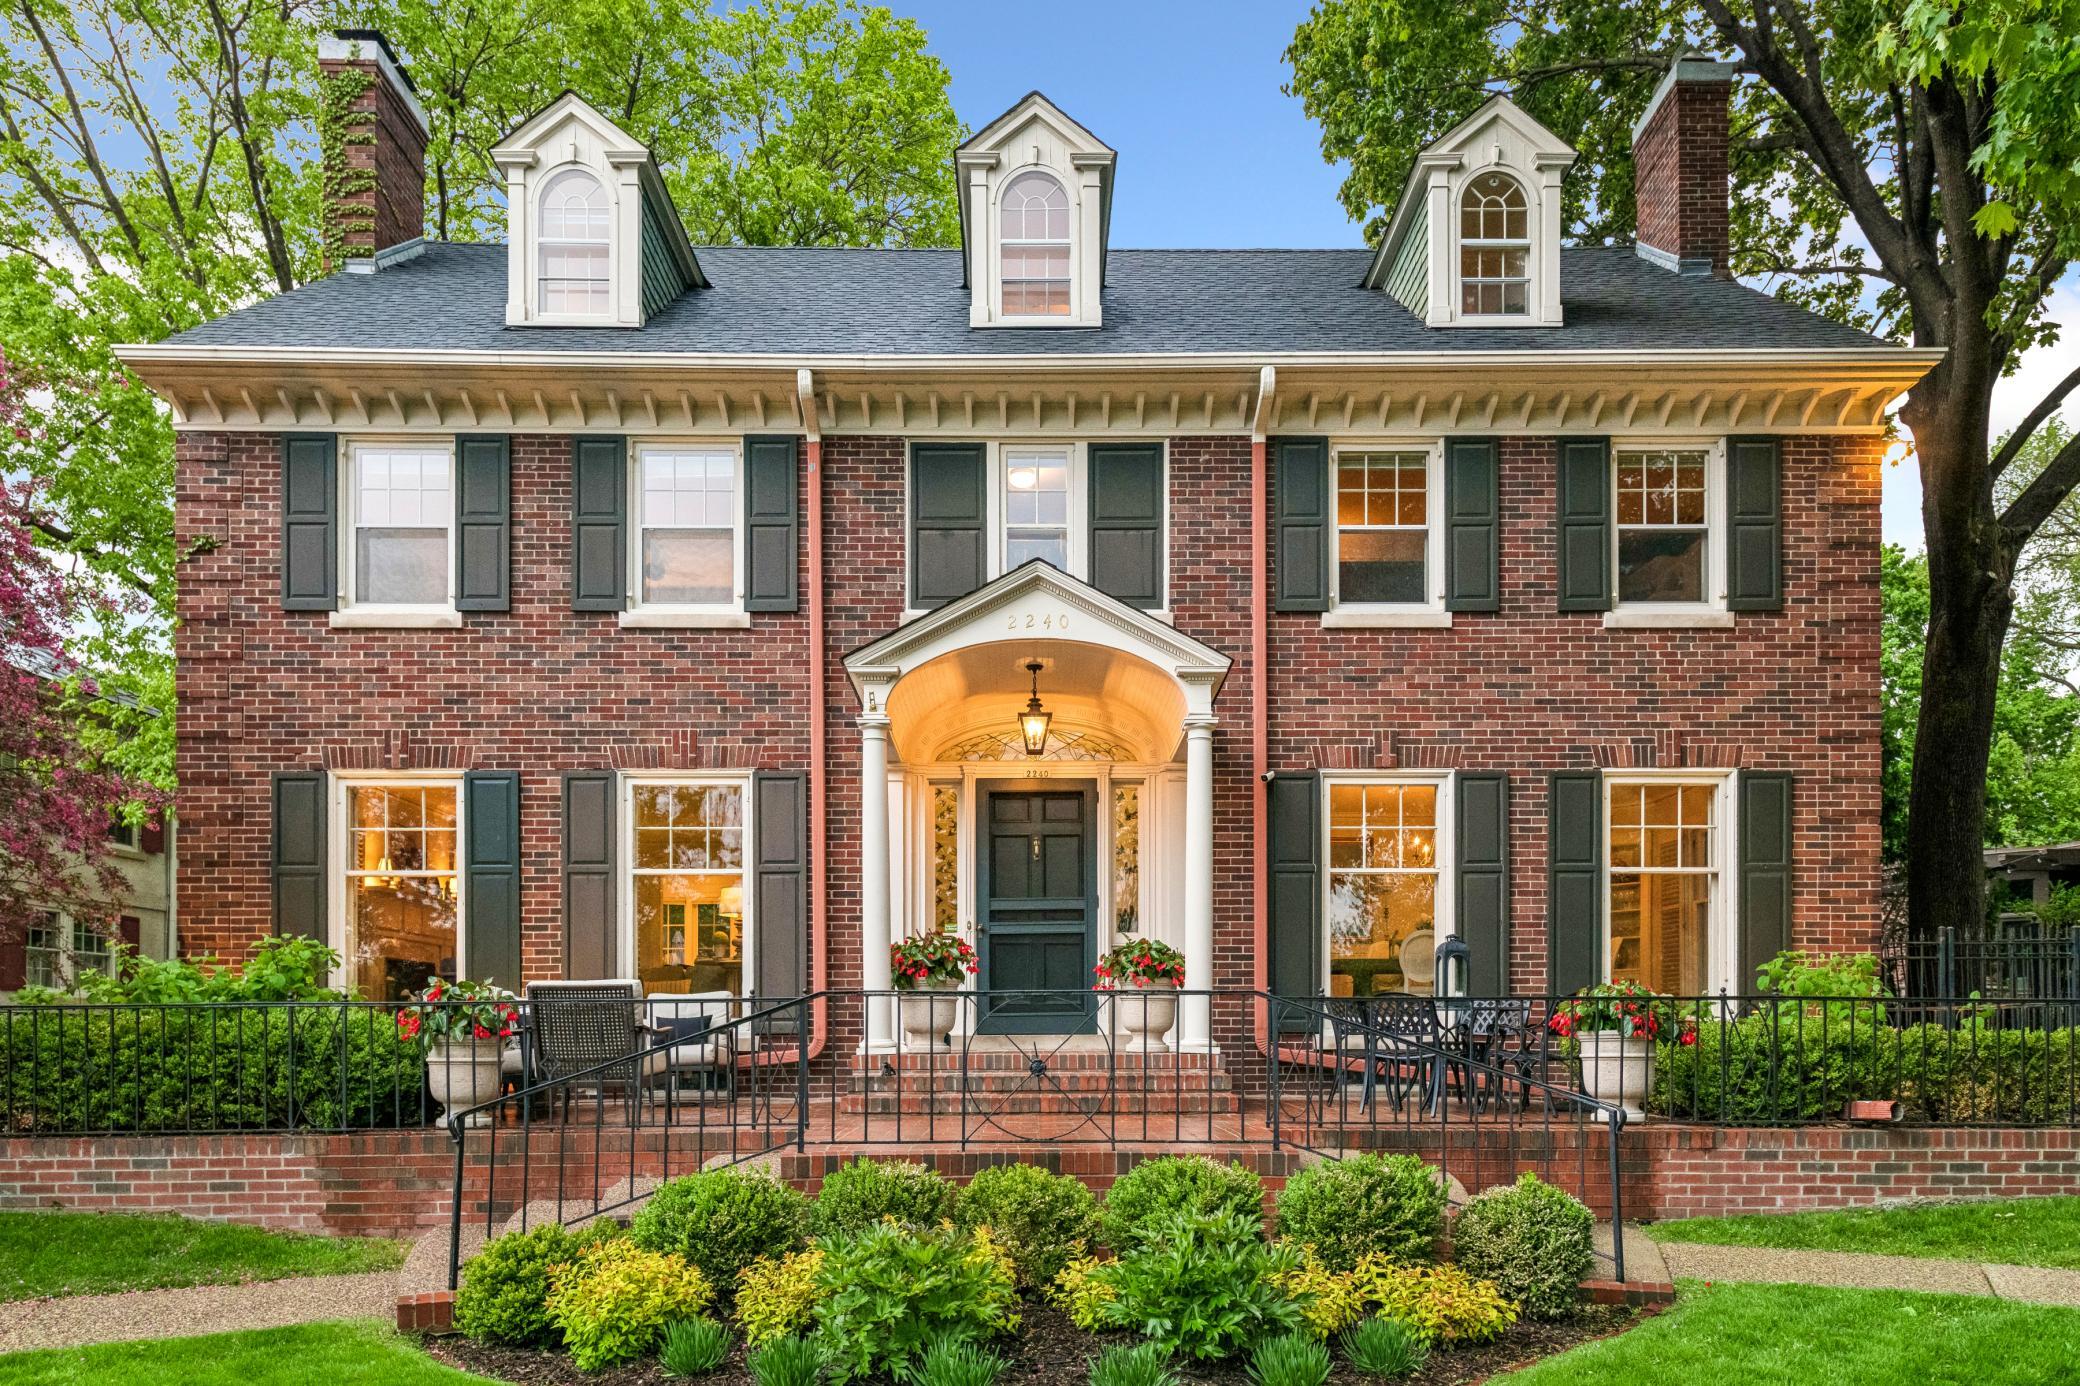
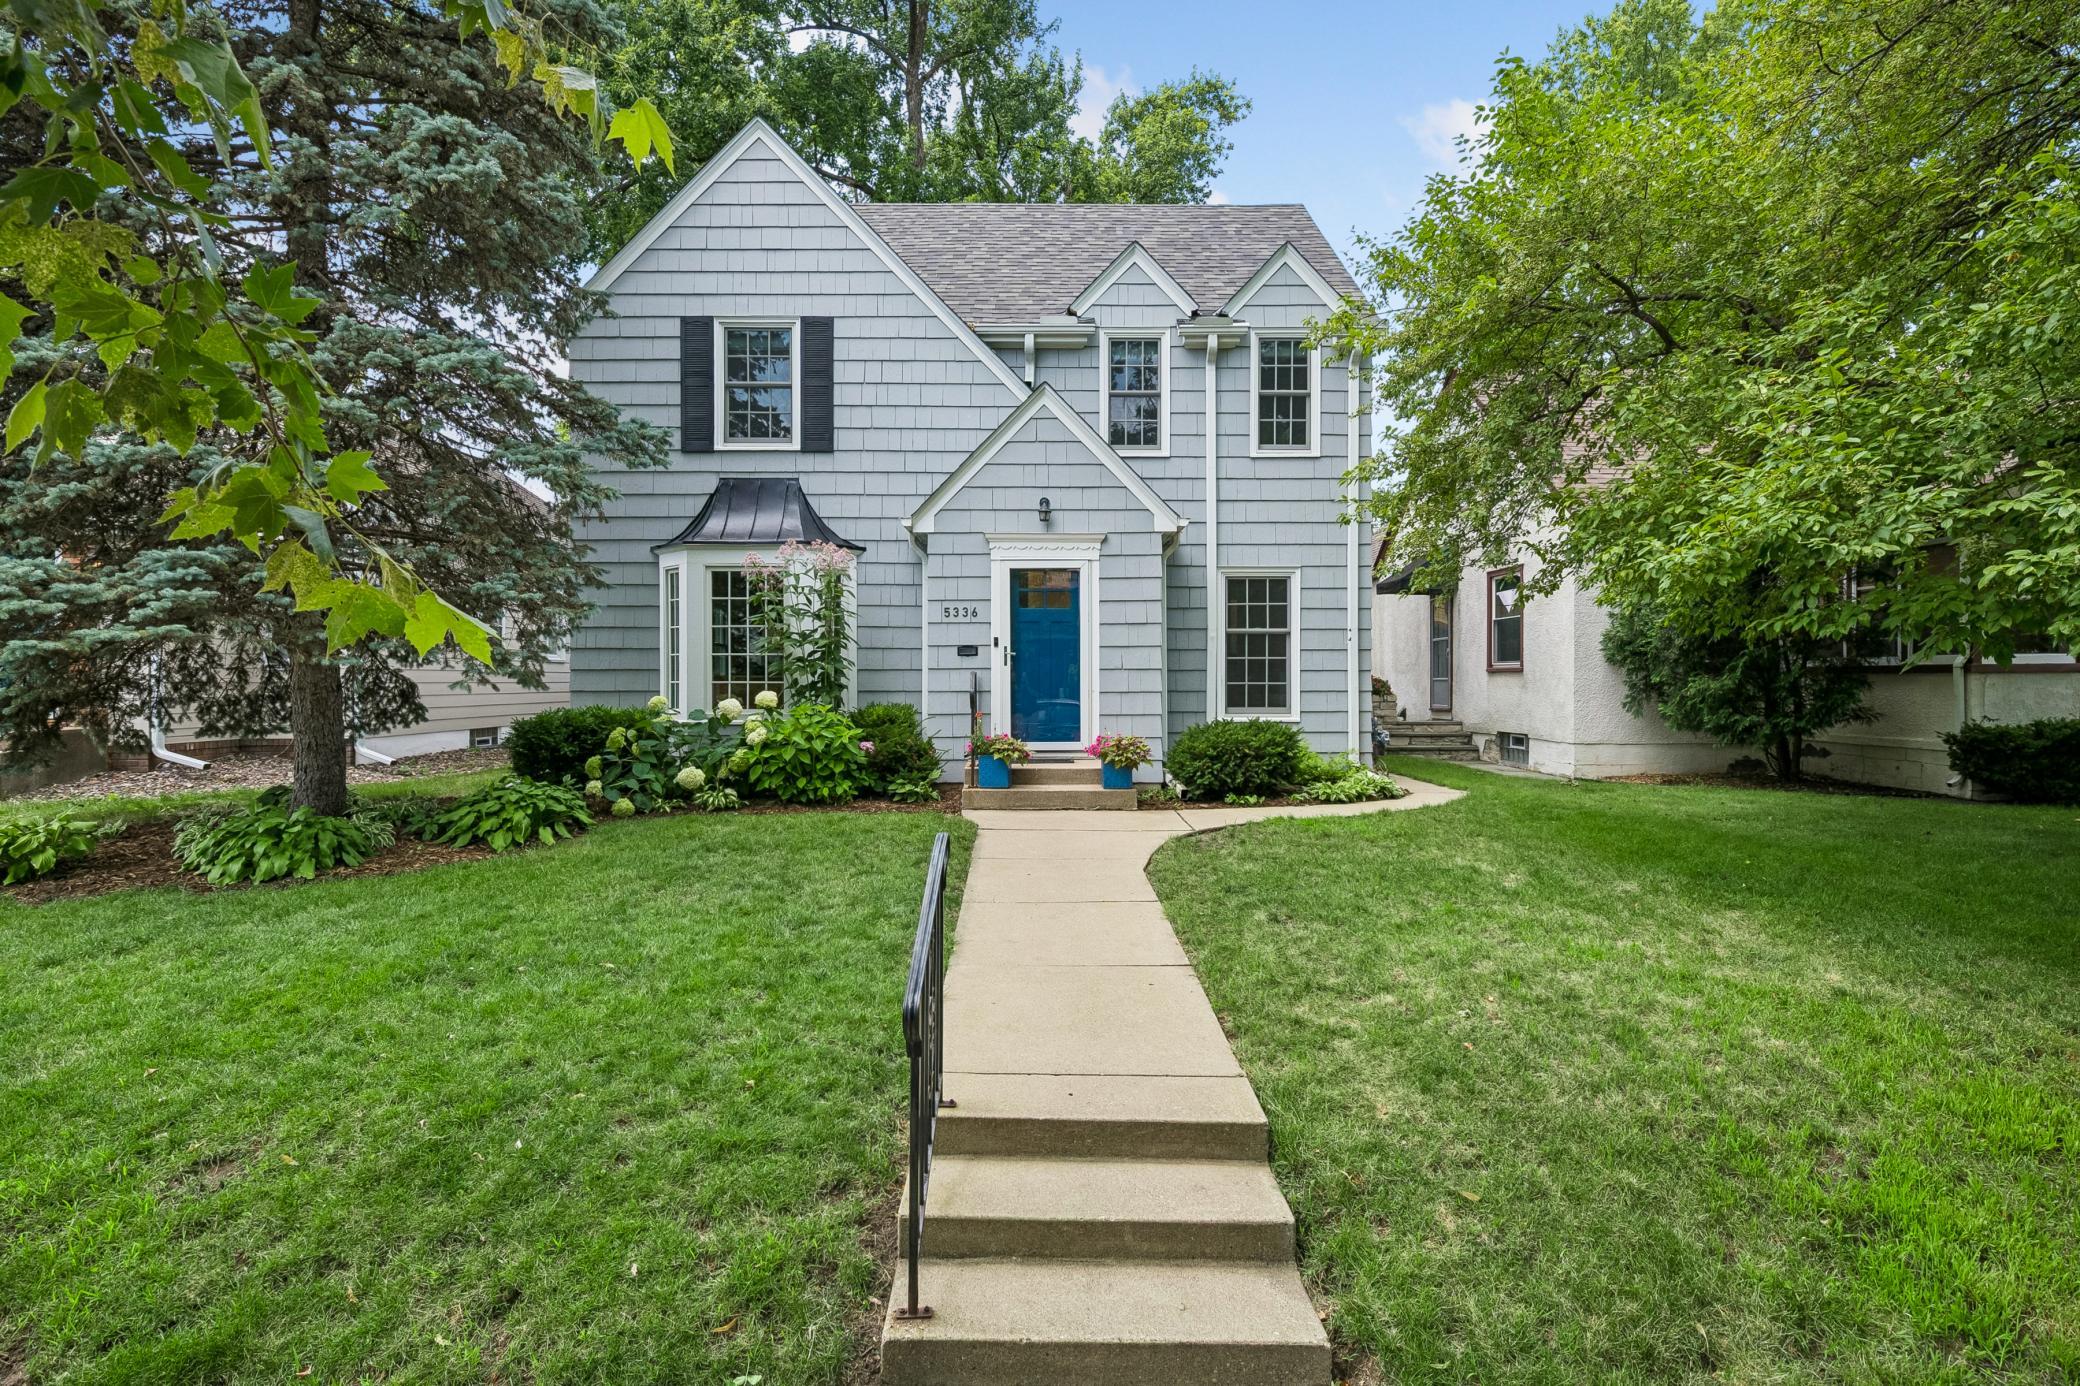
Lakeside Family ValueCharacter-rich 1920s Tudor residences and storybook story-and-a-half homes surround Lake Nokomis and Minnehaha Creek. Offering the best value entry points among Minneapolis lakefront corridors, Nokomis delivers exceptional park amenities, kayaking, beach recreation, and quick transit to MSP Airport and Downtown Minneapolis.
Data Extraction Matrix
Neighborhood | Best For | Primary Housing Stock | Price and Valuation Signal | School Catchment Access |
|---|---|---|---|---|
North Loop | Urban professionals, investors | Converted brick lofts, modern luxury condos | Highest price per sq ft; rapid appreciation | Downtown MPS, U of M proximity |
Linden Hills | Families, lake access buyers | 1920s Craftsman bungalows, renovated manors | Premium tier; tight inventory turnover | Linden Hills Elementary, Blake School |
Northeast (Nordeast) | Creatives, multi-family investors | Classic bungalows, 2 to 4 unit multi-family duplexes | Strong rental yields; 5.0% to 6.5% cap rates | Edison High School district |
Nokomis | Outdoor lovers, move-up families | 1920s Brick Tudors, storybook story-and-a-halfs | Best value among lakefront corridors | Nokomis Elementary, Sanford Middle |
Fulton and Tangletown | Upscale buyers, architecture enthusiasts | Colonial Revival, Tudor Revival, Mid-century | Stable equity; long-term capital preservation | Southwest High School IB program |
Sources: Regional Multiple Listing Service (RMLS) Data Ledgers, Minneapolis Municipal Finance Reports, Minneapolis Public Schools Boundary Maps.
Minneapolis serves as the financial and cultural core of the Upper Midwest. The citywide median home price holds steady near $375,000, with active housing inventory maintaining a lean 2.0 to 3.1 months of supply. Recent municipal budget updates moderated local property tax expansion rates to 8%, improving long-term holding cost parameters for home buyers.
Minneapolis operates as an authentic 15-minute city, where residents across core neighborhoods access groceries, public parks, and dining within an easy 15-minute walk or bike ride. In winter months, downtown and North Loop condo residents utilize the 9.5-mile climate-controlled Skyway system, connecting 80 city blocks completely insulated from cold weather elements.
School catchments strongly influence neighborhood property values. Families seeking public International Baccalaureate programs target homes in Fulton and Tangletown routed to Southwest High School. The southwest lake corridor provides immediate proximity to Linden Hills Elementary and the independent Blake School campus in neighboring Hopkins.
For real estate investors, Northeast Minneapolis delivers attractive 5.0% to 6.5% cap rates on multi-family duplexes, while North Loop lofts drive long-term capital appreciation. Exploring our Minneapolis property tax guide and partnering with an experienced managing broker ensures you navigate Twin Cities real estate with confidence.
Internal Knowledge Base
In-depth review of top residential neighborhoods across Minneapolis.
Comparative breakdown of prices, schools, and park access.
Understand municipal tax rates, assessment cycles, and holding costs.
Cap rate analysis, multi-family demand, and rental property strategies.
Common Inquiries
The citywide median sales price holds near $375,000, with active housing inventory tracking between 2.0 and 3.1 months of supply.
The North Loop leads for urban professionals due to converted brick lofts, award-winning dining, Skyway access, and proximity to Downtown employment centers.
Linden Hills, Fulton, Tangletown, and Nokomis are highly sought after by families due to Lake Harriet and Lake Nokomis access, parks, and top-rated school catchments.
The Minneapolis Skyway system spans 9.5 miles across 80 downtown city blocks, providing enclosed, climate-controlled pedestrian access year-round.
Contact BJ LaVelle, Managing Broker at Roost Real Estate / Compass, for expert real estate guidance and off-market property access across the Twin Cities.
BJ LaVelle | Managing Broker | License MN 40439162 | Roost Real Estate / Compass
With over 24 years of Twin Cities transactional experience, BJ LaVelle specializes in corporate relocation, lakefront single-family homes, and urban loft investments across Minneapolis.
Navigate Minneapolis Real Estate
Gain expert real estate guidance, neighborhood market analysis, and off-market property access with BJ LaVelle and Roost Real Estate.
There's plenty to do around Minneapolis, including shopping, dining, nightlife, parks, and more. Data provided by Walk Score and Yelp.
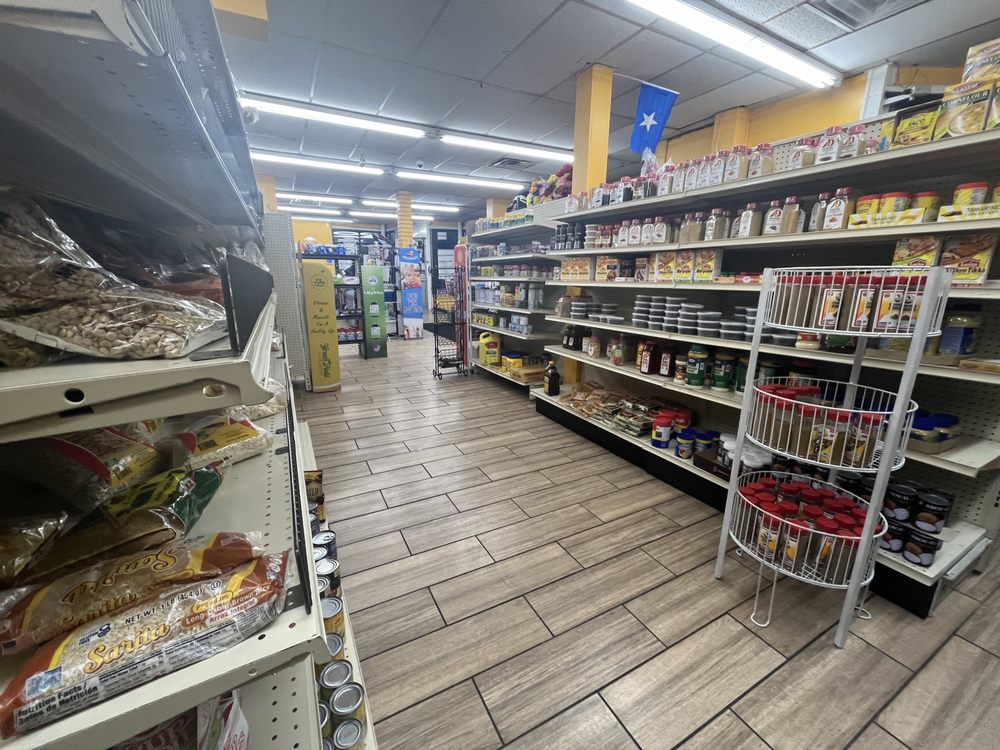
Explore popular things to do in the area, including Twin cities Coffee And Deli, Two Amigos Bazar 2, and 3rd & Franklin Amoco.
| Name | Category | Distance | Reviews |
Ratings by
Yelp
|
|---|---|---|---|---|
| Dining | 0.19 miles | 1 review | 3/5 stars | |
| Dining | 0.28 miles | 1 review | 1/5 stars | |
| Dining | 0.28 miles | 0 reviews | 0/5 stars | |
| Dining | 0.41 miles | 0 reviews | 0/5 stars | |
| Dining | 0.7 miles | 0 reviews | 0/5 stars | |
| Dining | 0.75 miles | 0 reviews | 0/5 stars | |
| Shopping | 0.48 miles | 0 reviews | 0/5 stars | |
| Shopping | 0.72 miles | 0 reviews | 0/5 stars | |
| Shopping | 0.83 miles | 1 review | 5/5 stars | |
| Active | 0.4 miles | 0 reviews | 0/5 stars | |
| Active | 0.54 miles | 5 reviews | 4.6/5 stars | |
| Active | 0.68 miles | 0 reviews | 0/5 stars | |
| Beauty | 0.36 miles | 0 reviews | 0/5 stars | |
| Beauty | 0.46 miles | 0 reviews | 0/5 stars | |
| Beauty | 0.58 miles | 0 reviews | 0/5 stars | |
| Beauty | 0.58 miles | 0 reviews | 0/5 stars | |
| Beauty | 0.59 miles | 1 review | 5/5 stars | |
| Beauty | 0.65 miles | 0 reviews | 0/5 stars | |
| Beauty | 0.66 miles | 0 reviews | 0/5 stars | |
| Beauty | 0.7 miles | 1 review | 3/5 stars | |
| Beauty | 0.72 miles | 0 reviews | 0/5 stars | |
| Beauty | 0.83 miles | 5 reviews | 5/5 stars | |
| Beauty | 0.84 miles | 0 reviews | 0/5 stars | |
| Beauty | 0.85 miles | 1 review | 5/5 stars | |
|
|
||||
|
|
||||
|
|
||||
|
|
||||
|
|
||||
|
|
Minneapolis has 188,944 households, with an average household size of 2.16. Data provided by the U.S. Census Bureau. Here’s what the people living in Minneapolis do for work — and how long it takes them to get there. Data provided by the U.S. Census Bureau. 426,845 people call Minneapolis home. The population density is 7,904.59 and the largest age group is Data provided by the U.S. Census Bureau.
Total Population
Population Density Population Density This is the number of people per square mile in a neighborhood.
Median Age
Men vs Women
Population by Age Group
0-9 Years
10-17 Years
18-24 Years
25-64 Years
65-74 Years
75+ Years
Education Level
Total Households
Average Household Size
Average individual Income
Households with Children
With Children:
Without Children:
Marital Status
Blue vs White Collar Workers
Blue Collar:
White Collar: